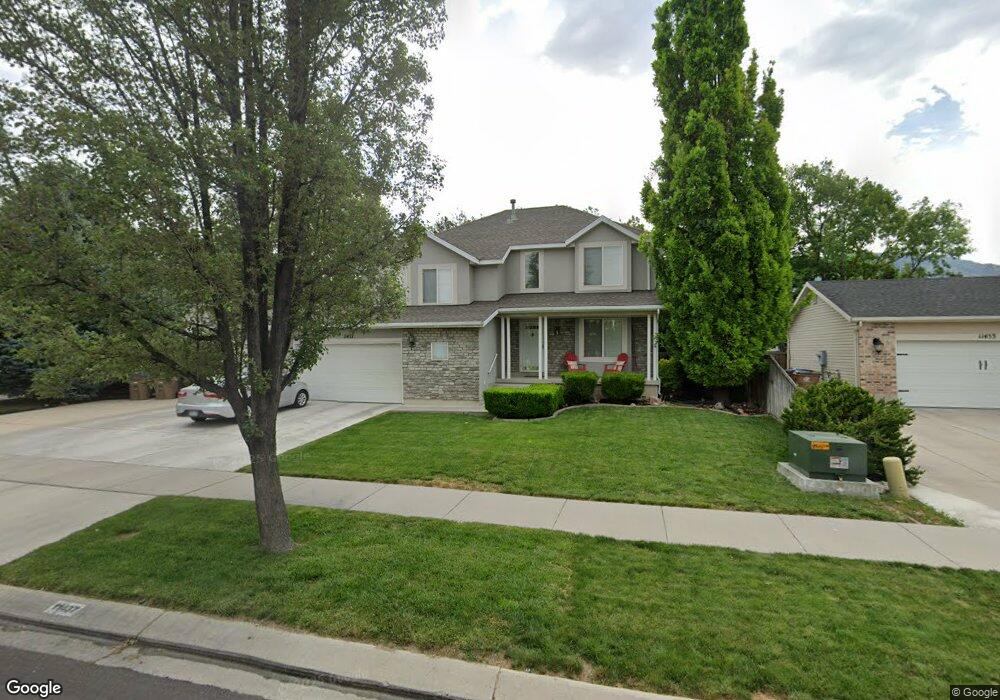
11437 S Raspberry Ct Draper, UT 84020
Estimated Value: $708,447 - $784,000
5
Beds
4
Baths
2,516
Sq Ft
$298/Sq Ft
Est. Value
About This Home
This home is located at 11437 S Raspberry Ct, Draper, UT 84020 and is currently estimated at $750,862, approximately $298 per square foot. 11437 S Raspberry Ct is a home located in Salt Lake County with nearby schools including Crescent School, Mount Jordan Middle School, and American Preparatory Academy - Draper 2 Campus.
Ownership History
Date
Name
Owned For
Owner Type
Purchase Details
Closed on
Mar 31, 2015
Sold by
Sullivan Thomas A and Sullivan Kelly A
Bought by
Jimerson Shawn M and Jimerson Larissa N
Current Estimated Value
Home Financials for this Owner
Home Financials are based on the most recent Mortgage that was taken out on this home.
Original Mortgage
$271,200
Outstanding Balance
$208,547
Interest Rate
3.71%
Mortgage Type
New Conventional
Estimated Equity
$542,315
Purchase Details
Closed on
Feb 11, 2008
Sold by
Sullivan Thomas A and Sullivan Kelly A
Bought by
Sullivan Thomas A and Sullivan Kelly A
Home Financials for this Owner
Home Financials are based on the most recent Mortgage that was taken out on this home.
Original Mortgage
$280,400
Interest Rate
6.04%
Mortgage Type
New Conventional
Purchase Details
Closed on
Nov 16, 2007
Sold by
Sullivan Thomas A and Sullivan Kelly A
Bought by
Sullivan Thomas A and Sullivan Kelly A
Home Financials for this Owner
Home Financials are based on the most recent Mortgage that was taken out on this home.
Original Mortgage
$275,492
Interest Rate
6.38%
Mortgage Type
New Conventional
Purchase Details
Closed on
Sep 15, 2006
Sold by
Sullivan Thomas A and Sullivan Kelly A
Bought by
Sullivan Thomas A and Sullivan Kelly A
Home Financials for this Owner
Home Financials are based on the most recent Mortgage that was taken out on this home.
Original Mortgage
$250,000
Interest Rate
6.51%
Mortgage Type
Purchase Money Mortgage
Purchase Details
Closed on
Aug 26, 2005
Sold by
Sullivan Thomas A and Sullivan Kelly A
Bought by
Sullivan Thomas A and Sullivan Kelly A
Home Financials for this Owner
Home Financials are based on the most recent Mortgage that was taken out on this home.
Original Mortgage
$220,000
Interest Rate
5.7%
Mortgage Type
New Conventional
Purchase Details
Closed on
Oct 14, 2004
Sold by
Sullivan Thomas A and Sullivan Kelly A
Bought by
Sullivan Thomas A and Sullivan Kelly A
Purchase Details
Closed on
Jul 15, 1996
Sold by
Ivory Homes
Bought by
Sullivan Thomas A and Sullivan Kelly A
Home Financials for this Owner
Home Financials are based on the most recent Mortgage that was taken out on this home.
Original Mortgage
$153,000
Interest Rate
8.03%
Create a Home Valuation Report for This Property
The Home Valuation Report is an in-depth analysis detailing your home's value as well as a comparison with similar homes in the area
Home Values in the Area
Average Home Value in this Area
Purchase History
| Date | Buyer | Sale Price | Title Company |
|---|---|---|---|
| Jimerson Shawn M | -- | Cottonwood Title | |
| Sullivan Thomas A | -- | Bonneville Superior Title | |
| Sullivan Thomas A | -- | Bonneville Superior Title | |
| Sullivan Thomas A | -- | Bonneville Superior Title | |
| Sullivan Thomas A | -- | Bonneville Superior Title | |
| Sullivan Thomas A | -- | First American Title | |
| Sullivan Thomas A | -- | First American Title | |
| Sullivan Thomas A | -- | Inwest Title Services | |
| Sullivan Thomas A | -- | Inwest Title Services | |
| Sullivan Thomas A | -- | -- | |
| Sullivan Thomas A | -- | -- |
Source: Public Records
Mortgage History
| Date | Status | Borrower | Loan Amount |
|---|---|---|---|
| Open | Jimerson Shawn M | $271,200 | |
| Previous Owner | Sullivan Thomas A | $280,400 | |
| Previous Owner | Sullivan Thomas A | $275,492 | |
| Previous Owner | Sullivan Thomas A | $250,000 | |
| Previous Owner | Sullivan Thomas A | $220,000 | |
| Previous Owner | Sullivan Thomas A | $153,000 |
Source: Public Records
Tax History
| Year | Tax Paid | Tax Assessment Tax Assessment Total Assessment is a certain percentage of the fair market value that is determined by local assessors to be the total taxable value of land and additions on the property. | Land | Improvement |
|---|---|---|---|---|
| 2025 | $3,200 | $630,800 | $216,700 | $414,100 |
| 2024 | $3,200 | $609,800 | $208,700 | $401,100 |
| 2023 | $3,165 | $598,700 | $203,800 | $394,900 |
| 2022 | $3,331 | $608,700 | $199,800 | $408,900 |
| 2021 | $2,856 | $445,700 | $188,300 | $257,400 |
| 2020 | $2,684 | $397,000 | $175,000 | $222,000 |
| 2019 | $2,679 | $387,200 | $175,000 | $212,200 |
| 2016 | $2,533 | $348,200 | $162,200 | $186,000 |
Source: Public Records
Map
Nearby Homes
- 11544 Olive Berry Ln
- 262 Hidden View Dr Unit 94
- 272 Hidden View Dr Unit 97
- 264 E Crescentwood Dr Unit 256
- 276 E Hidden View Dr Unit 98
- 11362 S Crescent Park Cir Unit 8
- 11310 S 265 E Unit 217
- 11313 S 265 E
- 244 E Crescent Park Way Unit 206
- 11265 S Crescent Park Cir
- 11290 S 265 E Unit 212
- 11228 S Jordan View Dr Unit 27
- 221 E Jordan View Dr
- 11243 Hidden View Dr Unit 122
- 468 E Montana Dr
- 11134 S 465 E
- 584 E Camden Pointe Cove
- 11873 Cottage View Ln
- 65 E 11000 S
- 11270 S Farnsworth Ln
- 11437 Raspberry Ct
- 11453 S Raspberry Ct
- 11453 Raspberry Ct
- 11444 S 150 E
- 11433 Raspberry Ct
- 11458 S 150 E
- 11432 S 150 E
- 11467 S Raspberry Ct
- 11467 Raspberry Ct
- 11448 Raspberry Ct
- 11307 S Crescent Pkwy Unit 82
- 11415 Raspberry Ct
- 11418 S 150 E
- 11468 S 150 E
- 11448 S Raspberry Ct
- 11462 Raspberry Ct
- 11412 Raspberry Ct
- 11412 S Raspberry Ct
- 11434 Raspberry Ct
- 11479 Raspberry Ct
Your Personal Tour Guide
Ask me questions while you tour the home.