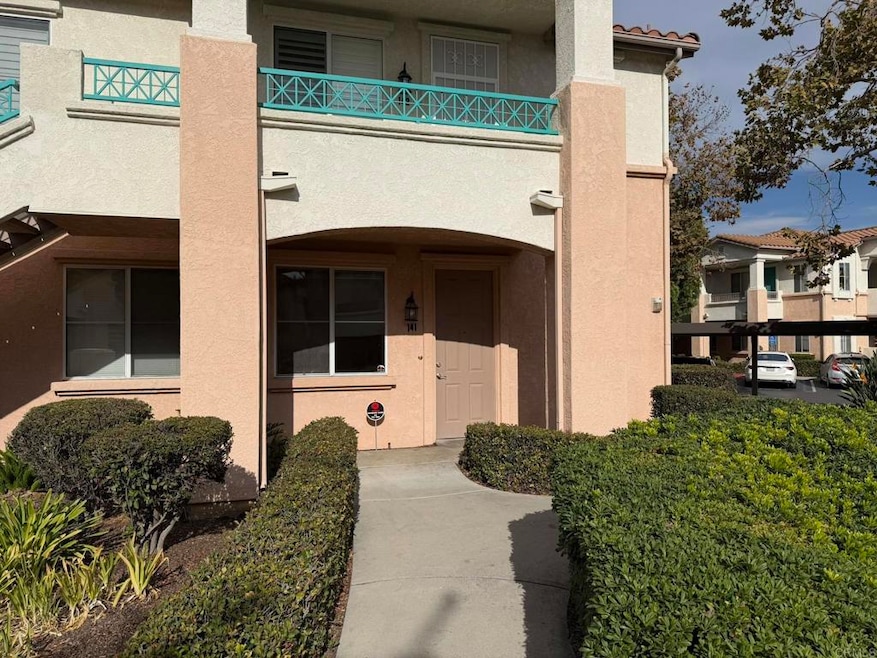

11438 Via Rancho San Diego Unit 141 El Cajon, CA 92019
Rancho Park NeighborhoodEstimated payment $3,453/month
Highlights
- Primary Bedroom Suite
- 1.31 Acre Lot
- Main Floor Primary Bedroom
- Valhalla High Rated A
- View of Hills
- Community Pool
About This Home
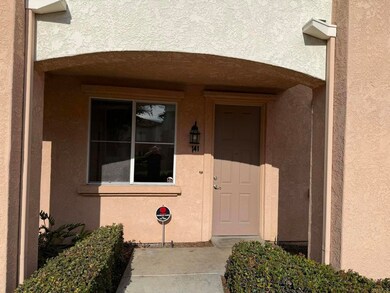
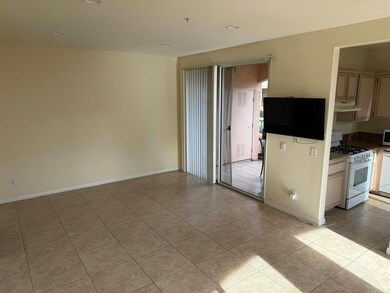
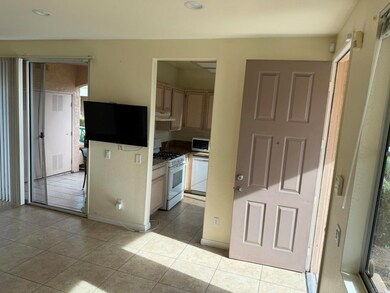
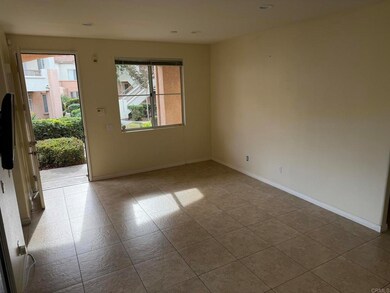
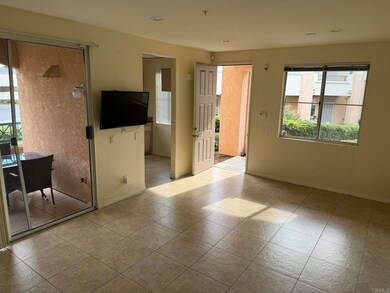
This 2BR, 2BA condo is move-in ready with easy street-level access and parking just steps from the entrance. Upon entering, you'll notice the spacious living and dining areas, now open and light-filled after the fireplace removal. The entire unit features an entirely tiled flooring. The upgraded kitchen boasts granite countertops. Step out of the living room to a cozy covered patio with an integrated laundry closet. The primary suite includes a built-in ironing table, while the primary bathroom has an extra storage cabinet. The condo is enhanced with recessed lighting, and both bedrooms feature ceiling fans with light fixtures.
Listing Agent
IQ Realty & Lending Brokerage Email: farisstephan@gmail.com License #01341039 Listed on: 11/15/2025
Property Details
Home Type
- Condominium
Est. Annual Taxes
- $4,520
Year Built
- Built in 1996
HOA Fees
- $335 Monthly HOA Fees
Home Design
- Entry on the 1st floor
Interior Spaces
- 861 Sq Ft Home
- 2-Story Property
- Living Room
- Views of Hills
Bedrooms and Bathrooms
- 2 Main Level Bedrooms
- Primary Bedroom on Main
- Primary Bedroom Suite
- 2 Full Bathrooms
Laundry
- Laundry Room
- Dryer
- Washer
Parking
- 1 Parking Space
- 1 Carport Space
- Parking Available
- Assigned Parking
Utilities
- Central Air
- No Heating
Additional Features
- Exterior Lighting
- Two or More Common Walls
Listing and Financial Details
- Tax Tract Number 12500
- Assessor Parcel Number 5020404705
Community Details
Overview
- 214 Units
- Helm Association, Phone Number (619) 589-6222
- Maintained Community
Recreation
- Community Pool
Pet Policy
- Pets Allowed with Restrictions
Security
- Resident Manager or Management On Site
Map
Home Values in the Area
Average Home Value in this Area
Tax History
| Year | Tax Paid | Tax Assessment Tax Assessment Total Assessment is a certain percentage of the fair market value that is determined by local assessors to be the total taxable value of land and additions on the property. | Land | Improvement |
|---|---|---|---|---|
| 2025 | $4,520 | $324,957 | $119,239 | $205,718 |
| 2024 | $4,520 | $318,586 | $116,901 | $201,685 |
| 2023 | $4,387 | $312,340 | $114,609 | $197,731 |
| 2022 | $4,298 | $306,216 | $112,362 | $193,854 |
| 2021 | $4,252 | $300,212 | $110,159 | $190,053 |
| 2020 | $4,172 | $297,135 | $109,030 | $188,105 |
| 2019 | $4,116 | $291,310 | $106,893 | $184,417 |
| 2018 | $4,008 | $285,599 | $104,798 | $180,801 |
| 2017 | $2,396 | $156,003 | $57,244 | $98,759 |
| 2016 | $2,285 | $152,945 | $56,122 | $96,823 |
| 2015 | $2,269 | $150,648 | $55,279 | $95,369 |
| 2014 | $2,233 | $147,698 | $54,197 | $93,501 |
Property History
| Date | Event | Price | List to Sale | Price per Sq Ft |
|---|---|---|---|---|
| 11/21/2025 11/21/25 | Price Changed | $519,000 | -1.9% | $603 / Sq Ft |
| 11/15/2025 11/15/25 | For Sale | $529,000 | -- | $614 / Sq Ft |
Purchase History
| Date | Type | Sale Price | Title Company |
|---|---|---|---|
| Grant Deed | -- | None Listed On Document | |
| Grant Deed | $280,000 | Chicago Title Company | |
| Grant Deed | $109,000 | First American Title |
Mortgage History
| Date | Status | Loan Amount | Loan Type |
|---|---|---|---|
| Previous Owner | $224,000 | New Conventional | |
| Previous Owner | $79,000 | Purchase Money Mortgage |
Source: California Regional Multiple Listing Service (CRMLS)
MLS Number: PTP2508604
APN: 502-040-47-05
Disclaimer: Certain information contained herein is derived from information provided by parties other than Homes.com. All information provided is deemed reliable, but is not guaranteed to be accurate and should be independently verified.
![]() The multiple listing data appearing on this website, or contained in reports produced therefrom, is owned and copyrighted by California Regional Multiple Listing Service, Inc. ("CRMLS") and is protected by all applicable copyright laws. Information provided is for viewer's personal, non-commercial use and may not be used for any purpose other than to identify prospective properties the viewer may be interested in purchasing. All listing data, including but not limited to square footage and lot size is believed to be accurate, but the listing Agent, listing Broker and CRMLS and its affiliates do not warrant or guarantee such accuracy. The viewer should independently verify the listed data prior to making any decisions based on such information by personal inspection and/or contacting a real estate professional.
The multiple listing data appearing on this website, or contained in reports produced therefrom, is owned and copyrighted by California Regional Multiple Listing Service, Inc. ("CRMLS") and is protected by all applicable copyright laws. Information provided is for viewer's personal, non-commercial use and may not be used for any purpose other than to identify prospective properties the viewer may be interested in purchasing. All listing data, including but not limited to square footage and lot size is believed to be accurate, but the listing Agent, listing Broker and CRMLS and its affiliates do not warrant or guarantee such accuracy. The viewer should independently verify the listed data prior to making any decisions based on such information by personal inspection and/or contacting a real estate professional.
Based on information from California Regional Multiple Listing Service, Inc. and /or other sources. All data, including all measurements and calculations of area, is obtained from various sources and has not been, and will not be, verified by broker or MLS. All information should be independently reviewed and verified for accuracy. Properties may or may not be listed by the office/agent presenting the information
- 11422 Via Rancho San Diego Unit 84
- 11382 Via Rancho San Diego Unit C
- 11378 Via Rancho San Diego Unit C
- 11376 Via Rancho San Diego Unit F
- 11358 Via Rancho San Diego
- 11368 Via Rancho San Diego Unit E
- 11738 Monte View Ct
- 12190 Cuyamaca College Dr E Unit 1100
- 12191 Cuyamaca College Dr E Unit 110
- 12191 Cuyamaca College Dr E Unit 712
- 12191 Cuyamaca College Dr E Unit 210
- 12191 Cuyamaca College Dr E Unit 213
- 12003 Calle de Leon Unit 3
- 12039 Calle de Leon Unit 24
- 12038 Calle de Leon
- 12020 Calle de Medio Unit 174
- 12034 Calle de Montana Unit 286
- 2458 Sawgrass St
- 2377 Congressional Dr
- 11586 Fury Ln Unit 133
- 11402 Via Rancho San Diego Unit 3
- 1451 Brabham St
- 2450 Hilton Head Place
- 12190 Cuyamaca College Dr E Unit 1009
- 12190 Cuyamaca College Dr E Unit 912
- 12367 Calle Albara
- 2003 Pierce Ct Unit ID1292558P
- 3802 Avenida Johanna
- 10874-10910 Calle Verde
- 10911 Sunray Place Unit Basement
- 10850 Jamacha Blvd
- 11015 Dutton Dr
- 1325 Old Chase Ave
- 3115 Sweetwater Springs Blvd
- 3265 Sweetwater Springs Blvd
- 10235 Madrid Way Unit 125
- 1730 Vista Del Valle Blvd Unit 1
- 3536 Sweetwater Springs Blvd
- 10150 Sierra Madre Rd Unit ID1347380P
- 10150 Sierra Madre Rd Unit ID1347379P
