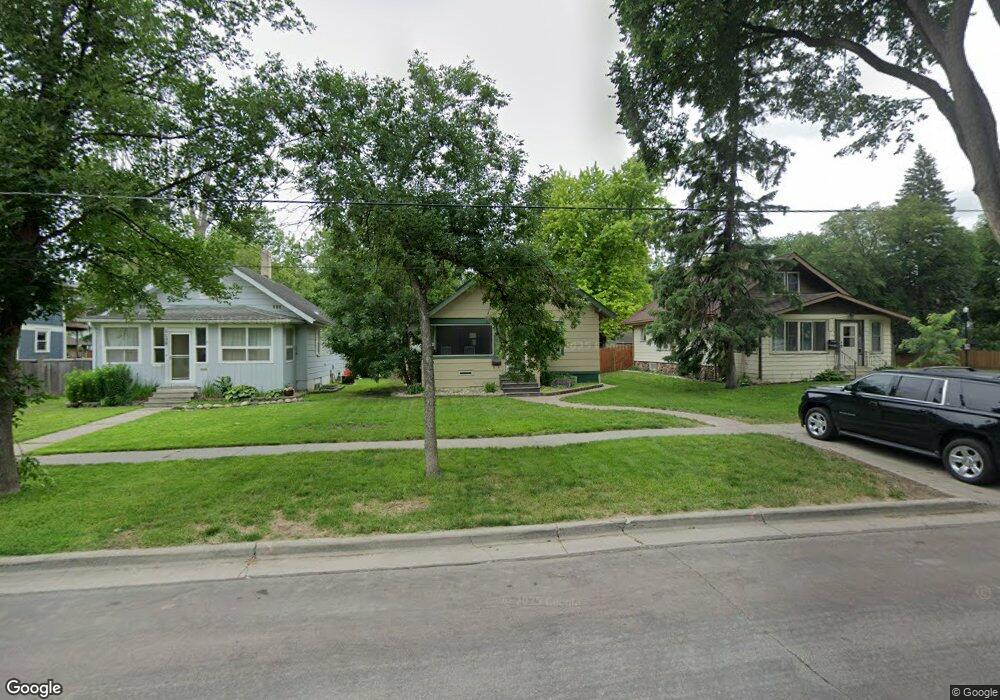
1144 3rd St N Fargo, ND 58102
Horace Mann NeighborhoodEstimated Value: $207,000 - $274,000
4
Beds
1
Bath
1,383
Sq Ft
$180/Sq Ft
Est. Value
About This Home
This home is located at 1144 3rd St N, Fargo, ND 58102 and is currently estimated at $248,353, approximately $179 per square foot. 1144 3rd St N is a home located in Cass County with nearby schools including Horace Mann Roosevelt Elementary School, Ben Franklin Middle School, and North High School.
Ownership History
Date
Name
Owned For
Owner Type
Purchase Details
Closed on
Aug 31, 2009
Sold by
Salonek Nick
Bought by
Donlin Amanda
Current Estimated Value
Home Financials for this Owner
Home Financials are based on the most recent Mortgage that was taken out on this home.
Original Mortgage
$93,279
Outstanding Balance
$62,110
Interest Rate
5.55%
Mortgage Type
FHA
Estimated Equity
$186,243
Purchase Details
Closed on
Jul 18, 2008
Sold by
Lewis Pamela Jo
Bought by
Salonck Nick
Create a Home Valuation Report for This Property
The Home Valuation Report is an in-depth analysis detailing your home's value as well as a comparison with similar homes in the area
Home Values in the Area
Average Home Value in this Area
Purchase History
| Date | Buyer | Sale Price | Title Company |
|---|---|---|---|
| Donlin Amanda | -- | -- | |
| Salonck Nick | -- | -- |
Source: Public Records
Mortgage History
| Date | Status | Borrower | Loan Amount |
|---|---|---|---|
| Open | Donlin Amanda | $93,279 |
Source: Public Records
Tax History
| Year | Tax Paid | Tax Assessment Tax Assessment Total Assessment is a certain percentage of the fair market value that is determined by local assessors to be the total taxable value of land and additions on the property. | Land | Improvement |
|---|---|---|---|---|
| 2024 | $4,301 | $129,800 | $19,200 | $110,600 |
| 2023 | $4,383 | $114,850 | $19,200 | $95,650 |
| 2022 | $4,286 | $109,400 | $19,200 | $90,200 |
| 2021 | $3,967 | $99,450 | $19,200 | $80,250 |
| 2020 | $2,850 | $94,700 | $19,200 | $75,500 |
| 2019 | $2,852 | $94,700 | $11,400 | $83,300 |
| 2018 | $2,755 | $92,200 | $11,400 | $80,800 |
| 2017 | $2,616 | $87,800 | $11,400 | $76,400 |
| 2016 | $2,369 | $85,250 | $11,400 | $73,850 |
| 2015 | $2,120 | $72,000 | $7,800 | $64,200 |
| 2014 | $1,998 | $65,450 | $7,800 | $57,650 |
| 2013 | $1,995 | $65,450 | $7,800 | $57,650 |
Source: Public Records
Map
Nearby Homes
- 1125 5th St N
- 1119 Broadway N
- 1257 4th St N
- 1249 2nd St N
- 1120 Broadway N
- 921 4th St N
- 1245 1st St N
- 1002 5th St N
- 915 Broadway N
- 902-904 N 1st Street North St N
- 1345 4th St N
- 624 10th Ave N
- 628 10th Ave N
- 804 3rd St N
- 1306 Elm St N
- 1119 9th St N
- 727 3rd St N
- 722 9th Ave N
- 1109 10th St N
- 1045 10th St N
Your Personal Tour Guide
Ask me questions while you tour the home.