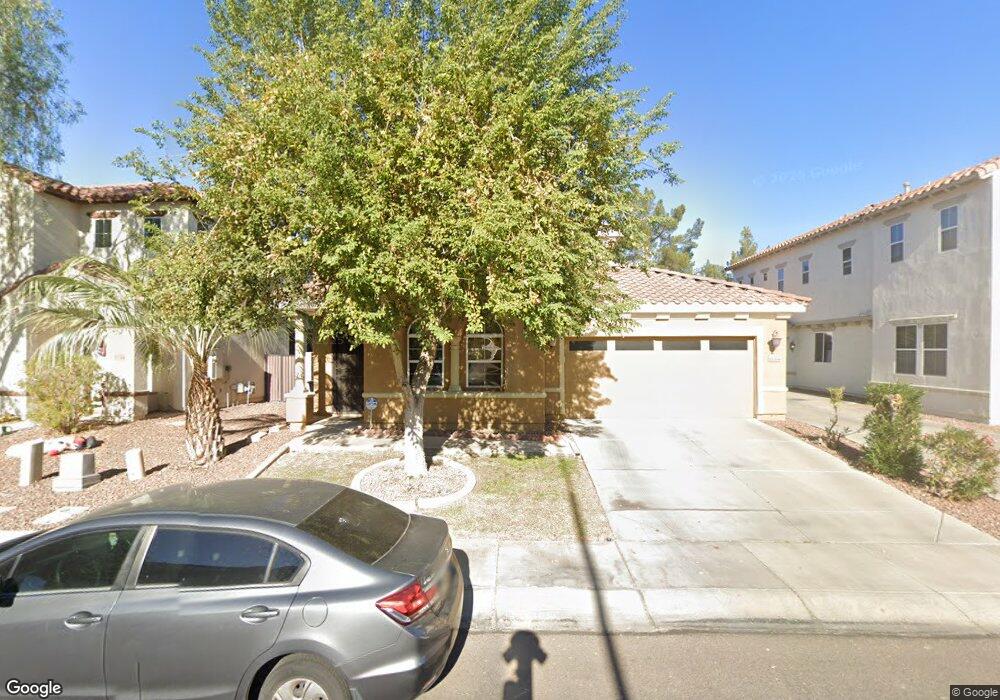
1144 E Gail Dr Chandler, AZ 85225
The Islands NeighborhoodEstimated Value: $508,000 - $662,000
Studio
4
Baths
2,760
Sq Ft
$214/Sq Ft
Est. Value
About This Home
This home is located at 1144 E Gail Dr, Chandler, AZ 85225 and is currently estimated at $591,554, approximately $214 per square foot. 1144 E Gail Dr is a home located in Maricopa County with nearby schools including Shumway Elementary School, Willis Junior High School, and Chandler High School.
Ownership History
Date
Name
Owned For
Owner Type
Purchase Details
Closed on
Mar 30, 2021
Sold by
Kaithavana Sreekumar V and Pillai Nisha
Bought by
Kaithavana Sreekumar Vijayamma and Pillai Nisha
Current Estimated Value
Purchase Details
Closed on
Nov 5, 2014
Sold by
Pillai Nisha
Bought by
Pillai Nisha and Kaithavana Sreekumar
Home Financials for this Owner
Home Financials are based on the most recent Mortgage that was taken out on this home.
Original Mortgage
$240,000
Outstanding Balance
$82,290
Interest Rate
4.17%
Mortgage Type
New Conventional
Estimated Equity
$509,264
Purchase Details
Closed on
Aug 18, 2008
Sold by
Vijayamma Sreekumar Kaithavana
Bought by
Pillai Nisha
Home Financials for this Owner
Home Financials are based on the most recent Mortgage that was taken out on this home.
Original Mortgage
$262,850
Interest Rate
6.59%
Mortgage Type
Purchase Money Mortgage
Create a Home Valuation Report for This Property
The Home Valuation Report is an in-depth analysis detailing your home's value as well as a comparison with similar homes in the area
Home Values in the Area
Average Home Value in this Area
Purchase History
| Date | Buyer | Sale Price | Title Company |
|---|---|---|---|
| Kaithavana Sreekumar Vijayamma | -- | None Available | |
| Pillai Nisha | -- | Accommodation | |
| Pillai Nisha | -- | Security Title Agency Inc | |
| Pillai Nisha | $292,100 | Security Title Agency Inc |
Source: Public Records
Mortgage History
| Date | Status | Borrower | Loan Amount |
|---|---|---|---|
| Open | Pillai Nisha | $240,000 | |
| Closed | Pillai Nisha | $262,850 |
Source: Public Records
Tax History
| Year | Tax Paid | Tax Assessment Tax Assessment Total Assessment is a certain percentage of the fair market value that is determined by local assessors to be the total taxable value of land and additions on the property. | Land | Improvement |
|---|---|---|---|---|
| 2025 | $2,327 | $29,876 | -- | -- |
| 2024 | $2,248 | $28,454 | -- | -- |
| 2023 | $2,248 | $40,760 | $8,150 | $32,610 |
| 2022 | $2,169 | $32,080 | $6,410 | $25,670 |
| 2021 | $2,273 | $31,200 | $6,240 | $24,960 |
| 2020 | $2,263 | $29,020 | $5,800 | $23,220 |
| 2019 | $2,177 | $27,830 | $5,560 | $22,270 |
| 2018 | $2,108 | $26,480 | $5,290 | $21,190 |
| 2017 | $1,964 | $24,950 | $4,990 | $19,960 |
| 2016 | $1,893 | $24,550 | $4,910 | $19,640 |
| 2015 | $1,834 | $22,650 | $4,530 | $18,120 |
Source: Public Records
Map
Nearby Homes
- 1030 N Mason Dr
- 1310 N Concord Ave
- 1146 E Dublin St
- 1445 E Countrywalk Ln
- 1402 E Shannon St
- 1456 E Park Ave
- 1255 W Sherri Dr
- 935 N Senate St
- 1594 E Megan St
- 955 E Knox Rd Unit 110
- 955 E Knox Rd Unit 118
- 955 E Knox Rd Unit 213
- 1449 E Kent Ave
- 1121 N Jackson St
- 1151 N Jackson St
- 1211 N Jackson St
- 860 N Mcqueen Rd Unit 1145
- 860 N Mcqueen Rd Unit 1060
- 860 N Mcqueen Rd Unit 1007
- 1214 W Iris Dr
- 1154 E Gail Dr
- 1134 E Gail Dr
- 1124 E Gail Dr
- 1164 E Gail Dr
- 1174 E Gail Dr
- 1114 E Gail Dr
- 1145 E Gail Dr
- 1135 E Gail Dr
- 1125 E Gail Dr
- 1155 E Gail Dr
- 1165 E Gail Dr
- 1115 E Gail Dr
- 1104 E Gail Dr
- 1105 E Gail Dr
- 1175 E Gail Dr
- 1148 E Park Ave
- 1131 E Baylor Ln
- 1138 E Park Ave
- 1121 E Baylor Ln
- 1185 E Gail Dr
Your Personal Tour Guide
Ask me questions while you tour the home.