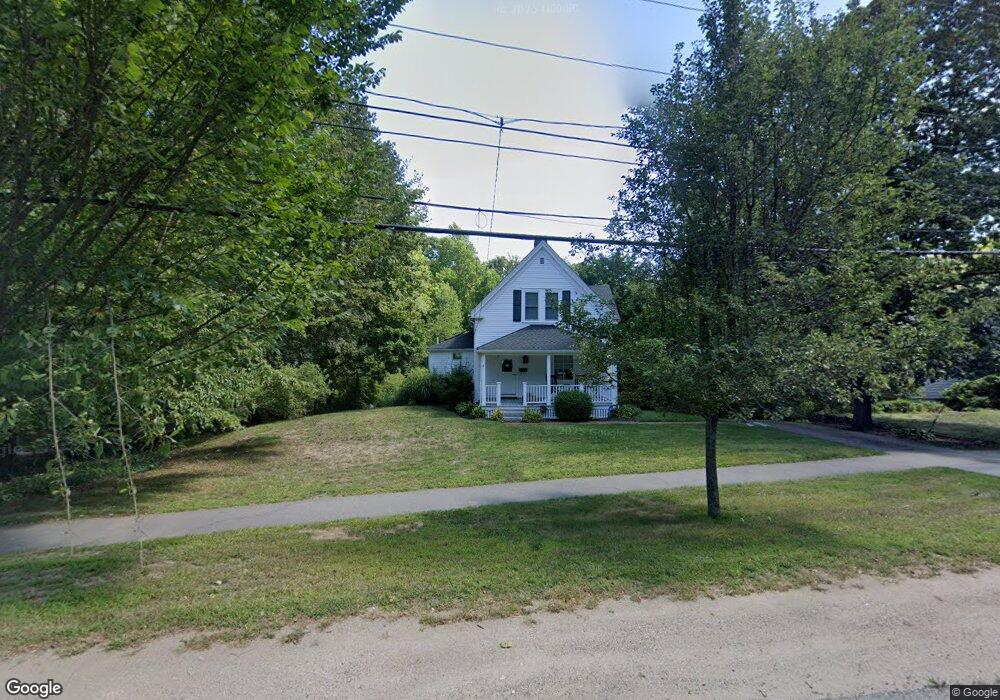
1144 Main St Hingham, MA 02043
South Hingham NeighborhoodEstimated Value: $917,481 - $1,231,000
2
Beds
1
Bath
1,221
Sq Ft
$854/Sq Ft
Est. Value
About This Home
This home is located at 1144 Main St, Hingham, MA 02043 and is currently estimated at $1,042,370, approximately $853 per square foot. 1144 Main St is a home located in Plymouth County with nearby schools including South Elementary School, Hingham Middle School, and Hingham High School.
Ownership History
Date
Name
Owned For
Owner Type
Purchase Details
Closed on
May 23, 2008
Sold by
Deady Jeffrey and Machado-Deady Sarah E
Bought by
Hemmer Courtney B
Current Estimated Value
Home Financials for this Owner
Home Financials are based on the most recent Mortgage that was taken out on this home.
Original Mortgage
$469,630
Outstanding Balance
$298,346
Interest Rate
5.94%
Mortgage Type
Purchase Money Mortgage
Estimated Equity
$744,024
Purchase Details
Closed on
Jan 16, 2004
Sold by
Bagley Paul M
Bought by
Deady Jeffrey R and Deady Sarah Machado
Home Financials for this Owner
Home Financials are based on the most recent Mortgage that was taken out on this home.
Original Mortgage
$322,700
Interest Rate
5.98%
Mortgage Type
Purchase Money Mortgage
Purchase Details
Closed on
Aug 28, 1996
Sold by
Est Arkell Alice M and Arkell Howard A
Bought by
Bagley Paul M
Create a Home Valuation Report for This Property
The Home Valuation Report is an in-depth analysis detailing your home's value as well as a comparison with similar homes in the area
Home Values in the Area
Average Home Value in this Area
Purchase History
| Date | Buyer | Sale Price | Title Company |
|---|---|---|---|
| Hemmer Courtney B | $477,000 | -- | |
| Deady Jeffrey R | $442,000 | -- | |
| Bagley Paul M | $175,000 | -- |
Source: Public Records
Mortgage History
| Date | Status | Borrower | Loan Amount |
|---|---|---|---|
| Open | Bagley Paul M | $469,630 | |
| Previous Owner | Bagley Paul M | $417,000 | |
| Previous Owner | Bagley Paul M | $322,700 | |
| Previous Owner | Bagley Paul M | $97,200 |
Source: Public Records
Tax History
| Year | Tax Paid | Tax Assessment Tax Assessment Total Assessment is a certain percentage of the fair market value that is determined by local assessors to be the total taxable value of land and additions on the property. | Land | Improvement |
|---|---|---|---|---|
| 2025 | $8,285 | $775,000 | $494,800 | $280,200 |
| 2024 | $7,769 | $716,000 | $494,800 | $221,200 |
| 2023 | $7,053 | $705,300 | $494,800 | $210,500 |
| 2022 | $7,185 | $621,500 | $413,000 | $208,500 |
| 2021 | $7,033 | $596,000 | $413,000 | $183,000 |
| 2020 | $6,851 | $594,200 | $413,000 | $181,200 |
| 2019 | $6,876 | $582,200 | $413,000 | $169,200 |
| 2018 | $6,775 | $575,600 | $413,000 | $162,600 |
| 2017 | $6,658 | $543,500 | $391,500 | $152,000 |
| 2016 | $6,530 | $522,800 | $373,500 | $149,300 |
| 2015 | $6,290 | $502,000 | $356,200 | $145,800 |
Source: Public Records
Map
Nearby Homes
- 100 Whiting St
- 1 Kerri Ln
- 4 Kerri Ln
- 183 Gardner St
- 22 Longmeadow Rd
- 17 Pine Haven Cir
- 214 Washington St Unit 24
- 214 Washington St Unit 28
- 18 Whiting Ln
- 9 Mast Hill Rd
- 18 Colby St
- 5 Old County Rd
- 5 Blueberry Ct
- 8 Blueberry Ct
- 55 Turner Rd
- 251 Prospect St
- 49 Washington Park Dr
- 18 Winterberry Ln
- 738 Whiting St
- 225 Prospect St
- 1148 Main St
- 1154 Main St
- 1139 Main St
- 1143 Main St
- 1150 Main St
- 1142 Main St
- 1135 Main St
- 1131 Main St
- 1126 Main St
- 1129 Main St
- 1169 Main St
- 1166 Main St
- 1175 Main St
- 2 Queen Anne Ln
- 4 King Philip Path
- 2 King Philip Path
- 6 King Philip Path
- 1111 Main St
- 1111 Main St Unit 1111
- 1111 Main St Unit none
Your Personal Tour Guide
Ask me questions while you tour the home.