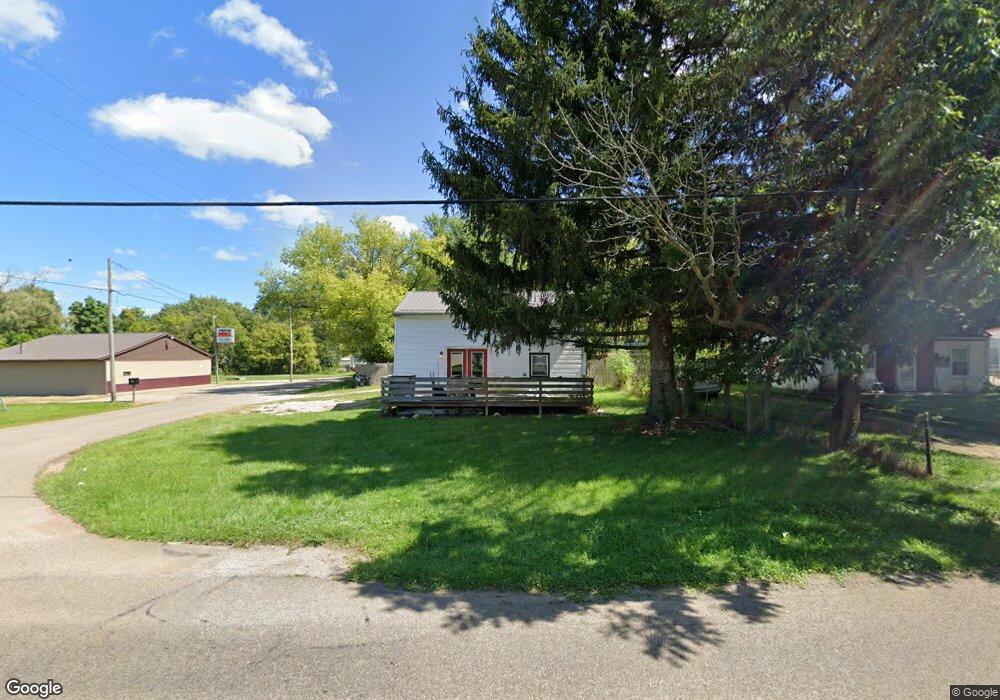
1144 N Trimble Rd Mansfield, OH 44906
Estimated Value: $91,000 - $106,000
2
Beds
1
Bath
1,092
Sq Ft
$91/Sq Ft
Est. Value
About This Home
This home is located at 1144 N Trimble Rd, Mansfield, OH 44906 and is currently estimated at $98,839, approximately $90 per square foot. 1144 N Trimble Rd is a home located in Richland County with nearby schools including Foundation Academy, Mansfield Elective Academy, and Goal Digital Academy.
Ownership History
Date
Name
Owned For
Owner Type
Purchase Details
Closed on
Jun 5, 2014
Sold by
Sweeney Tonie J
Bought by
Sweeney Tamara D
Current Estimated Value
Purchase Details
Closed on
Jun 8, 2006
Sold by
Lyon Falls Llc
Bought by
Sweeney Tonie J
Home Financials for this Owner
Home Financials are based on the most recent Mortgage that was taken out on this home.
Original Mortgage
$60,000
Outstanding Balance
$41,107
Interest Rate
9.75%
Mortgage Type
Stand Alone First
Estimated Equity
$57,732
Purchase Details
Closed on
May 24, 2005
Sold by
Rightway Real Estate Investment Inc
Bought by
Lyon Falls Llc
Purchase Details
Closed on
May 20, 2005
Sold by
Hilty Mark D and Hilty Micah Nicole
Bought by
Rightway Real Estate Investment Inc
Purchase Details
Closed on
Jul 1, 2003
Sold by
Hilty Mark D and Hilty Julie A
Bought by
Hilty Mark D
Purchase Details
Closed on
Oct 21, 1993
Sold by
Shelton Ronald E
Bought by
Shelton Ronald E
Create a Home Valuation Report for This Property
The Home Valuation Report is an in-depth analysis detailing your home's value as well as a comparison with similar homes in the area
Home Values in the Area
Average Home Value in this Area
Purchase History
| Date | Buyer | Sale Price | Title Company |
|---|---|---|---|
| Sweeney Tamara D | -- | Attorney | |
| Sweeney Tonie J | $60,000 | None Available | |
| Lyon Falls Llc | $41,500 | -- | |
| Rightway Real Estate Investment Inc | $41,500 | -- | |
| Hilty Mark D | -- | -- | |
| Shelton Ronald E | $15,000 | -- |
Source: Public Records
Mortgage History
| Date | Status | Borrower | Loan Amount |
|---|---|---|---|
| Open | Sweeney Tonie J | $60,000 |
Source: Public Records
Tax History Compared to Growth
Tax History
| Year | Tax Paid | Tax Assessment Tax Assessment Total Assessment is a certain percentage of the fair market value that is determined by local assessors to be the total taxable value of land and additions on the property. | Land | Improvement |
|---|---|---|---|---|
| 2024 | $758 | $13,790 | $3,030 | $10,760 |
| 2023 | $758 | $13,790 | $3,030 | $10,760 |
| 2022 | $1,068 | $13,880 | $2,870 | $11,010 |
| 2021 | $932 | $13,880 | $2,870 | $11,010 |
| 2020 | $949 | $13,880 | $2,870 | $11,010 |
| 2019 | $903 | $11,770 | $2,440 | $9,330 |
| 2018 | $851 | $11,770 | $2,440 | $9,330 |
| 2017 | $829 | $11,770 | $2,440 | $9,330 |
| 2016 | $867 | $11,850 | $2,490 | $9,360 |
| 2015 | $867 | $11,850 | $2,490 | $9,360 |
| 2014 | $952 | $11,850 | $2,490 | $9,360 |
| 2012 | $1,209 | $12,470 | $2,620 | $9,850 |
Source: Public Records
Map
Nearby Homes
- 1170 Fairfax Ave
- 1134 Fairfax Ave
- 1245 N Trimble Rd
- 933 Fairfax Ave
- 946 Belmont Ave
- 0 Herring Ave
- 876 Fairfax Ave
- 874 Fairfax Ave
- 939 Country Club Dr
- 0 Stone Rd
- 741 Burger Ave
- 1234 Walker St
- 1592 Walker Woods Blvd
- 1169 Seminole Ave
- 1168 & 1171 Seminole Ave
- 1598 Spring Village Ln
- 1631 Deer View Cir
- 674 Averill Ave
- Lot 2 Spring Village Ln
- 0 Walker Lake Rd
- 1136 N Trimble Rd
- 1132 N Trimble Rd
- 1128 N Trimble Rd
- 1172 N Trimble Rd
- 1039 Hahn Rd
- 1122 N Trimble Rd
- 1161 N Trimble Rd
- 1145 N Trimble Rd
- 1139 N Trimble Rd
- 1133 N Trimble Rd
- 1174 N Trimble Rd
- 1140 Lenox Ave
- 1136 Lenox Ave
- 1163 Woodside Dr
- 1130 Lenox Ave
- 1113 Lenox Ave
- 1083 Nestor Dr
- 1112 N Trimble Rd
- 1112 N Trimble Rd
- 1017 Hahn Rd