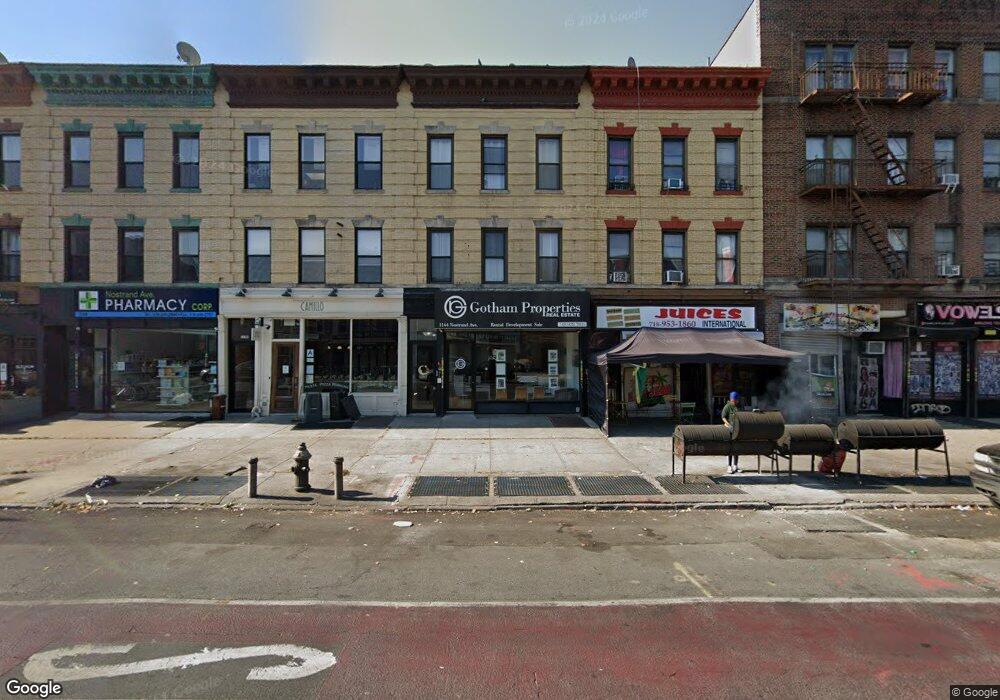
1144 Nostrand Ave Brooklyn, NY 11225
Prospect Lefferts Gardens NeighborhoodEstimated Value: $1,623,374
--
Bed
--
Bath
3,000
Sq Ft
$541/Sq Ft
Est. Value
About This Home
This home is located at 1144 Nostrand Ave, Brooklyn, NY 11225 and is currently estimated at $1,623,374, approximately $541 per square foot. 1144 Nostrand Ave is a home located in Kings County with nearby schools including P.S. 91 The Albany Avenue School, M.S. 61 Dr. Gladstone H. Atwell Middle School, and Achievement First Voyager Middle School.
Ownership History
Date
Name
Owned For
Owner Type
Purchase Details
Closed on
Feb 15, 2024
Sold by
Atkins Family Llc and Jaba Group Llc
Bought by
1144 Nostrand Ave Llc
Current Estimated Value
Home Financials for this Owner
Home Financials are based on the most recent Mortgage that was taken out on this home.
Original Mortgage
$87,323
Outstanding Balance
$85,786
Interest Rate
6.63%
Mortgage Type
Purchase Money Mortgage
Estimated Equity
$1,537,588
Purchase Details
Closed on
Dec 6, 2022
Sold by
Mdb Holdings Group Llc
Bought by
Atkins Family Llc and Jaba Group Llc
Purchase Details
Closed on
Dec 31, 2020
Sold by
1144 Nostrand Llc
Bought by
Mdb Holdings Group Llc
Purchase Details
Closed on
Oct 8, 2014
Sold by
Graham Ana C and Graham Roberto S
Bought by
1144 Nostrand Llc
Create a Home Valuation Report for This Property
The Home Valuation Report is an in-depth analysis detailing your home's value as well as a comparison with similar homes in the area
Home Values in the Area
Average Home Value in this Area
Purchase History
| Date | Buyer | Sale Price | Title Company |
|---|---|---|---|
| 1144 Nostrand Ave Llc | $1,535,000 | -- | |
| 1144 Nostrand Ave Llc | $1,535,000 | -- | |
| Atkins Family Llc | $358,594 | -- | |
| Atkins Family Llc | $358,594 | -- | |
| Mdb Holdings Group Llc | -- | -- | |
| Mdb Holdings Group Llc | -- | -- | |
| 1144 Nostrand Llc | $750,000 | -- | |
| 1144 Nostrand Llc | $750,000 | -- |
Source: Public Records
Mortgage History
| Date | Status | Borrower | Loan Amount |
|---|---|---|---|
| Open | 1144 Nostrand Ave Llc | $87,323 | |
| Closed | 1144 Nostrand Ave Llc | $87,323 |
Source: Public Records
Tax History Compared to Growth
Tax History
| Year | Tax Paid | Tax Assessment Tax Assessment Total Assessment is a certain percentage of the fair market value that is determined by local assessors to be the total taxable value of land and additions on the property. | Land | Improvement |
|---|---|---|---|---|
| 2025 | $6,663 | $337,050 | $72,000 | $265,050 |
| 2024 | $6,663 | $302,850 | $72,000 | $230,850 |
| 2023 | $6,335 | $280,800 | $72,000 | $208,800 |
| 2022 | $5,851 | $294,750 | $72,000 | $222,750 |
| 2021 | $5,432 | $261,450 | $72,000 | $189,450 |
| 2020 | $2,472 | $278,100 | $72,000 | $206,100 |
| 2019 | $5,171 | $231,750 | $72,000 | $159,750 |
| 2018 | $5,053 | $39,725 | $14,816 | $24,909 |
| 2017 | $4,678 | $36,783 | $14,460 | $22,323 |
| 2016 | $4,391 | $34,060 | $15,888 | $18,172 |
| 2015 | $2,851 | $31,538 | $17,644 | $13,894 |
| 2014 | $2,851 | $31,538 | $21,202 | $10,336 |
Source: Public Records
Map
Nearby Homes
- 267 Rutland Rd
- 259 Rutland Rd Unit 2B
- 259 Rutland Rd Unit 5B
- 259 Rutland Rd Unit 4A
- 259 Rutland Rd Unit 3C
- 259 Rutland Rd Unit 3A
- 259 Rutland Rd Unit 2C
- 259 Rutland Rd Unit 3B
- 259 Rutland Rd Unit 2A
- 287 Midwood St
- 250 Midwood St
- 1105 Nostrand Ave
- 310 Fenimore St
- 312 Fenimore St
- 343 Rutland Rd
- 246 Maple St Unit 3A
- 277 Maple St
- 265 Maple St
- 340 Lincoln Rd
- 220 Rutland Rd
- 1142 Nostrand Ave
- 1148 Nostrand Ave
- 1148 Nostrand Ave Unit 2
- 1148 Nostrand Ave Unit 3
- 295 Rutland Rd
- 1150 Nostrand Ave
- 291 Rutland Rd
- 287 Rutland Rd
- 288 Midwood St
- 286 Midwood St
- 285 Rutland Rd
- 1152 Nostrand Ave
- 1154 Nostrand Ave
- 1154 Nostrand Ave Unit 1
- 1154 Nostrand Ave Unit 2L
- 1143 Nostrand Ave Unit 2
- 1143 Nostrand Ave Unit 1
- 1143 Nostrand Ave
- 284 Midwood St
- 1139 Nostrand Ave