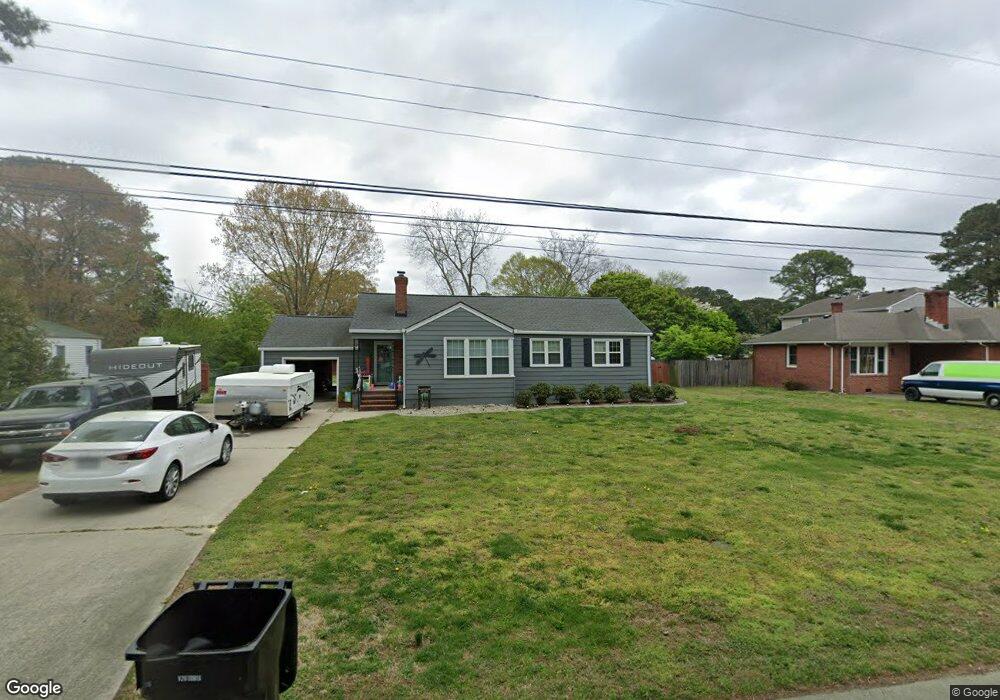
1144 Olive Rd Virginia Beach, VA 23464
Estimated Value: $417,000 - $438,000
3
Beds
2
Baths
1,600
Sq Ft
$268/Sq Ft
Est. Value
About This Home
This home is located at 1144 Olive Rd, Virginia Beach, VA 23464 and is currently estimated at $428,563, approximately $267 per square foot. 1144 Olive Rd is a home located in Virginia Beach City with nearby schools including Kempsville Elementary School, Kempsville Middle School, and Kempsville High School.
Ownership History
Date
Name
Owned For
Owner Type
Purchase Details
Closed on
Jul 1, 2021
Sold by
Phillips Jace C and Phillips Angela L
Bought by
Grauberger Mark L and Grauberger Patricia R
Current Estimated Value
Home Financials for this Owner
Home Financials are based on the most recent Mortgage that was taken out on this home.
Original Mortgage
$310,000
Outstanding Balance
$281,277
Interest Rate
2.9%
Mortgage Type
New Conventional
Estimated Equity
$147,286
Purchase Details
Closed on
Oct 7, 2015
Sold by
Just Right Homes Llc A Virginia Limited
Bought by
Phillips Jace C and Phillips Angela L
Home Financials for this Owner
Home Financials are based on the most recent Mortgage that was taken out on this home.
Original Mortgage
$255,375
Interest Rate
3.88%
Mortgage Type
VA
Purchase Details
Closed on
Jun 15, 2015
Sold by
Bottiglier Trustee Edward M and The Ainsworth Revocable Living
Bought by
Just Right Homes Llc
Create a Home Valuation Report for This Property
The Home Valuation Report is an in-depth analysis detailing your home's value as well as a comparison with similar homes in the area
Home Values in the Area
Average Home Value in this Area
Purchase History
| Date | Buyer | Sale Price | Title Company |
|---|---|---|---|
| Grauberger Mark L | $360,000 | Sun Title Inc | |
| Phillips Jace C | $250,000 | Sage Title Llc | |
| Just Right Homes Llc | $126,500 | -- |
Source: Public Records
Mortgage History
| Date | Status | Borrower | Loan Amount |
|---|---|---|---|
| Open | Grauberger Mark L | $310,000 | |
| Previous Owner | Phillips Jace C | $255,375 |
Source: Public Records
Tax History Compared to Growth
Tax History
| Year | Tax Paid | Tax Assessment Tax Assessment Total Assessment is a certain percentage of the fair market value that is determined by local assessors to be the total taxable value of land and additions on the property. | Land | Improvement |
|---|---|---|---|---|
| 2025 | $3,527 | $375,800 | $165,000 | $210,800 |
| 2024 | $3,527 | $363,600 | $165,000 | $198,600 |
| 2023 | $3,570 | $360,600 | $162,000 | $198,600 |
| 2022 | $3,248 | $328,100 | $137,500 | $190,600 |
| 2021 | $2,480 | $250,500 | $110,000 | $140,500 |
| 2020 | $2,417 | $237,500 | $103,000 | $134,500 |
| 2019 | $2,488 | $237,500 | $103,000 | $134,500 |
| 2018 | $2,381 | $237,500 | $103,000 | $134,500 |
| 2017 | $2,381 | $237,500 | $103,000 | $134,500 |
| 2016 | $2,282 | $230,500 | $103,000 | $127,500 |
| 2015 | $1,888 | $190,700 | $108,900 | $81,800 |
| 2014 | $2,807 | $192,000 | $122,100 | $69,900 |
Source: Public Records
Map
Nearby Homes
- 1076 Burlington Rd
- 1209 Acredale Rd
- 1313 Burlington Rd
- 1084 Willowbrooke Ct
- 5308 Alishire Ct
- 5421 Glamis Ct
- 1340 Burlington Rd
- 5109 Fallsmead Downs
- 1053 Yardley Landing
- 1104 Derken Ct
- 5097 Andover Rd
- 5113 Stratford Chase Dr
- 5417 Chatham Hall Dr
- 5151 Westerly Dr
- 1216 Ferndale Ct
- 5008 Christian Cir
- 1032 Taylor Rd
- 1488 Coolspring Way
- 5317 Chabot Way
- 5254 Lake Victoria Arch
- 1140 Olive Rd
- 1148 Olive Rd
- 1136 Olive Rd
- 1137 Burlington Rd
- 1133 Burlington Rd
- 1141 Burlington Rd
- 1145 Olive Rd
- 1200 Olive Rd
- 1149 Olive Rd
- 1141 Olive Rd
- 1129 Burlington Rd
- 1132 Olive Rd
- 1137 Olive Rd
- 1201 Burlington Rd
- 1204 Olive Rd
- 1125 Burlington Rd
- 1201 Olive Rd
- 1129 Olive Rd
- 5224 Andover Rd
- 1128 Olive Rd