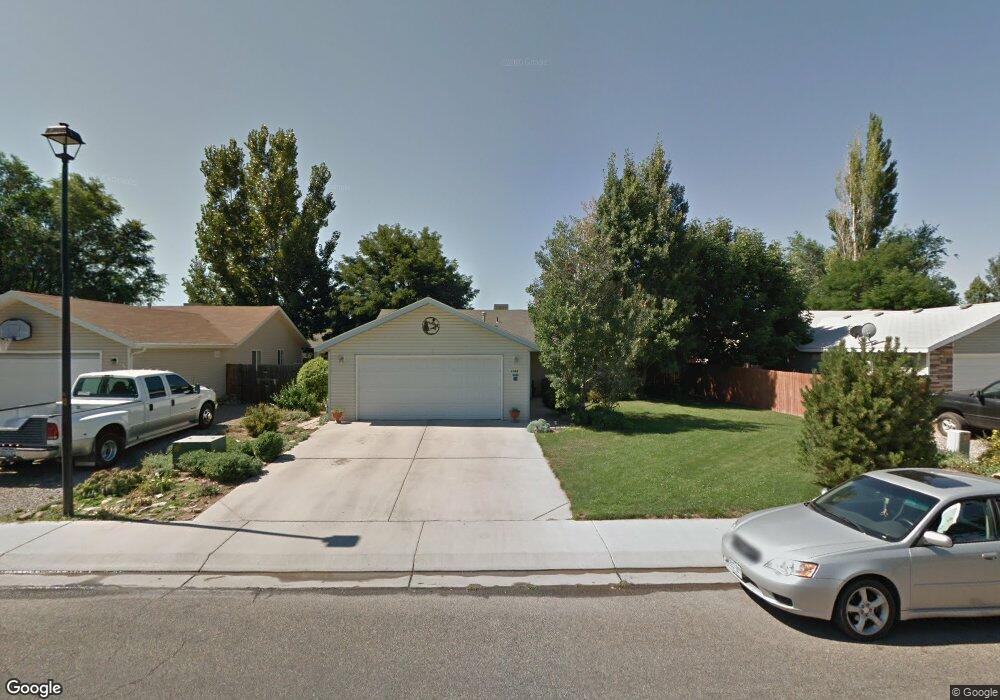
1144 Powell St Fruita, CO 81521
Estimated Value: $344,742 - $369,000
3
Beds
2
Baths
1,124
Sq Ft
$321/Sq Ft
Est. Value
About This Home
This home is located at 1144 Powell St, Fruita, CO 81521 and is currently estimated at $360,436, approximately $320 per square foot. 1144 Powell St is a home located in Mesa County with nearby schools including Monument Ridge Elementary School, Fruita Middle School, and Fruita 8/9 School.
Ownership History
Date
Name
Owned For
Owner Type
Purchase Details
Closed on
Jul 25, 2000
Sold by
Moss Dorothy M
Bought by
Ganss David William and Ganss Donna Jean
Current Estimated Value
Purchase Details
Closed on
Oct 28, 1999
Sold by
Simon Beth Simon Jason
Bought by
Moss Dorothy M
Home Financials for this Owner
Home Financials are based on the most recent Mortgage that was taken out on this home.
Original Mortgage
$30,000
Interest Rate
7.77%
Purchase Details
Closed on
Nov 3, 1998
Sold by
Simon Beth
Bought by
Simon Beth and Simon Jason
Home Financials for this Owner
Home Financials are based on the most recent Mortgage that was taken out on this home.
Original Mortgage
$67,100
Interest Rate
6.92%
Mortgage Type
Stand Alone First
Purchase Details
Closed on
Sep 30, 1998
Sold by
Shadowfax Properties Inc
Bought by
Simon Beth
Home Financials for this Owner
Home Financials are based on the most recent Mortgage that was taken out on this home.
Original Mortgage
$67,100
Interest Rate
6.92%
Mortgage Type
Stand Alone First
Create a Home Valuation Report for This Property
The Home Valuation Report is an in-depth analysis detailing your home's value as well as a comparison with similar homes in the area
Home Values in the Area
Average Home Value in this Area
Purchase History
| Date | Buyer | Sale Price | Title Company |
|---|---|---|---|
| Ganss David William | $99,900 | First American Title Co | |
| Moss Dorothy M | $99,000 | -- | |
| Simon Beth | -- | -- | |
| Simon Beth | $83,900 | First American Title |
Source: Public Records
Mortgage History
| Date | Status | Borrower | Loan Amount |
|---|---|---|---|
| Previous Owner | Moss Dorothy M | $30,000 | |
| Previous Owner | Simon Beth | $67,100 |
Source: Public Records
Tax History
| Year | Tax Paid | Tax Assessment Tax Assessment Total Assessment is a certain percentage of the fair market value that is determined by local assessors to be the total taxable value of land and additions on the property. | Land | Improvement |
|---|---|---|---|---|
| 2024 | $960 | $18,470 | $3,910 | $14,560 |
| 2023 | $960 | $18,470 | $3,910 | $14,560 |
| 2022 | $781 | $16,370 | $3,820 | $12,550 |
| 2021 | $786 | $16,840 | $3,930 | $12,910 |
| 2020 | $561 | $14,100 | $3,580 | $10,520 |
| 2019 | $535 | $14,100 | $3,580 | $10,520 |
| 2018 | $497 | $12,080 | $3,240 | $8,840 |
| 2017 | $477 | $12,080 | $3,240 | $8,840 |
| 2016 | $449 | $12,610 | $3,580 | $9,030 |
Source: Public Records
Map
Nearby Homes
- 1148 Powell St
- 1123 Sprocket Ct
- 1152 Cherrywood Ave
- 351 Mee Canyon Cir
- 812 Alyssum Ct
- 1121 & 392 Hatchet Canyon Cir
- 1113 & 1115 Hatchet Canyon Cir
- 1111 Sprocket Ct
- 921 Caledonia Ct
- 376 Toms Canyon Dr
- 376 Hatchet Canyon Cir
- 1112 Sprocket Ct
- 362 Toms Canyon Dr
- 370 Toms Canyon Dr
- 1026 Lone Tree Ct
- 1107 Mee Canyon Cir
- 1109 Mee Canyon Cir
- 1124 Sprocket Ct
- 1105 Sprocket Ct
- 1107 & 1109 Mee Canyon Cir
- 1152 Powell St
- 1169 Aquarius Ave
- 1165 Aquarius Ave
- 1136 Powell St
- 1141 Powell St
- 1171 Aquarius Ave
- 1163 Aquarius Ave
- 1254 Powell St
- 1157 Aquarius Ave
- 1154 Locust St
- 1129 Powell St
- 1143 Locust St
- 1132 Powell St
- 0 Locust St
- 1201 Aquarius Ave
- 1276 Powell St
- 1205 Aquarius Ave
- 1150 Aquarius Ave
- 1153 Aquarius Ave
- 1162 Aquarius Ave
Your Personal Tour Guide
Ask me questions while you tour the home.