Estimated Value: $242,535 - $281,000
--
Bed
--
Bath
1,057
Sq Ft
$244/Sq Ft
Est. Value
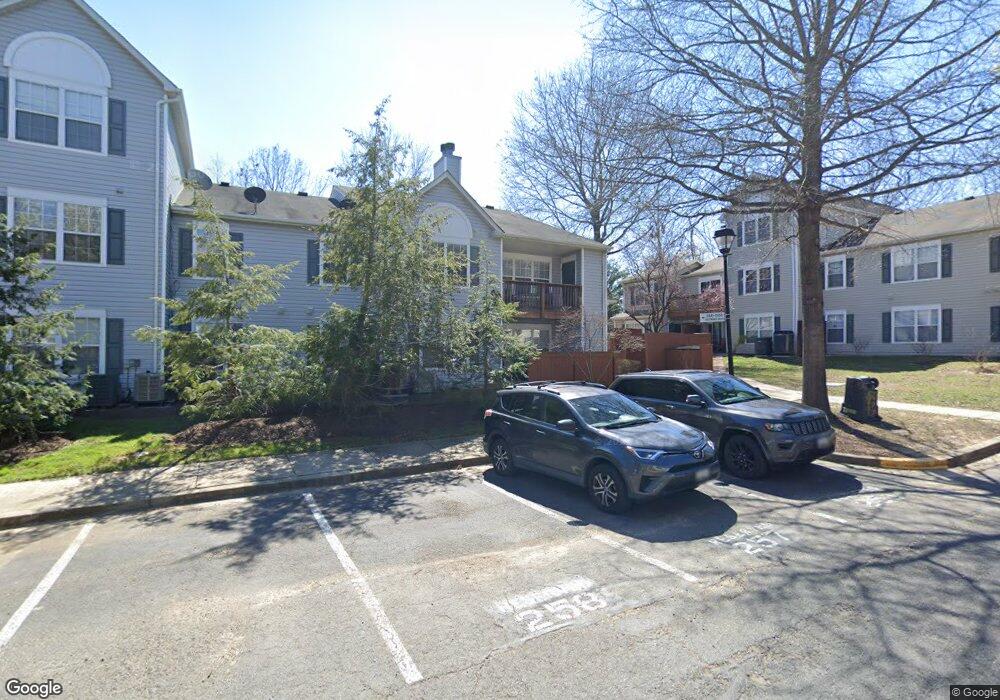
About This Home
This home is located at 11441 Deepwood Dr, Bowie, MD 20720 and is currently estimated at $258,134, approximately $244 per square foot. 11441 Deepwood Dr is a home located in Prince George's County with nearby schools including Woodmore Elementary School, Thomas Johnson Middle School, and Duval High School.
Ownership History
Date
Name
Owned For
Owner Type
Purchase Details
Closed on
May 11, 2021
Sold by
Adger Ondrea
Bought by
Adger Justin B and Adger Ondrea
Current Estimated Value
Home Financials for this Owner
Home Financials are based on the most recent Mortgage that was taken out on this home.
Original Mortgage
$167,500
Outstanding Balance
$138,372
Interest Rate
2.9%
Mortgage Type
New Conventional
Estimated Equity
$119,762
Purchase Details
Closed on
Dec 15, 2017
Sold by
Adger Ondrea and Holliday Ondrea P
Bought by
Adger Ondrea
Home Financials for this Owner
Home Financials are based on the most recent Mortgage that was taken out on this home.
Original Mortgage
$138,100
Interest Rate
4.43%
Mortgage Type
New Conventional
Purchase Details
Closed on
Dec 28, 2004
Sold by
Holl Tracy A
Bought by
Holliday Ondrea P
Purchase Details
Closed on
Nov 9, 2004
Sold by
Holl Tracy A
Bought by
Holliday Ondrea P
Purchase Details
Closed on
May 26, 1998
Sold by
Washington Homes Inc
Bought by
Holland Tracy A
Create a Home Valuation Report for This Property
The Home Valuation Report is an in-depth analysis detailing your home's value as well as a comparison with similar homes in the area
Home Values in the Area
Average Home Value in this Area
Purchase History
| Date | Buyer | Sale Price | Title Company |
|---|---|---|---|
| Adger Justin B | -- | Old Line Title Company Inc | |
| Adger Ondrea | -- | Vantage Point Title | |
| Holliday Ondrea P | $170,000 | -- | |
| Holliday Ondrea P | $170,000 | -- | |
| Holland Tracy A | $79,999 | -- |
Source: Public Records
Mortgage History
| Date | Status | Borrower | Loan Amount |
|---|---|---|---|
| Open | Adger Justin B | $167,500 | |
| Closed | Adger Ondrea | $138,100 |
Source: Public Records
Tax History Compared to Growth
Tax History
| Year | Tax Paid | Tax Assessment Tax Assessment Total Assessment is a certain percentage of the fair market value that is determined by local assessors to be the total taxable value of land and additions on the property. | Land | Improvement |
|---|---|---|---|---|
| 2025 | $3,105 | $190,000 | -- | -- |
| 2024 | $3,105 | $182,500 | $0 | $0 |
| 2023 | $2,992 | $175,000 | $52,500 | $122,500 |
| 2022 | $4,488 | $175,000 | $52,500 | $122,500 |
| 2021 | $2,992 | $175,000 | $52,500 | $122,500 |
| 2020 | $6,727 | $200,000 | $60,000 | $140,000 |
| 2019 | $2,530 | $176,667 | $0 | $0 |
| 2018 | $2,279 | $153,333 | $0 | $0 |
| 2017 | $2,537 | $130,000 | $0 | $0 |
| 2016 | -- | $123,333 | $0 | $0 |
| 2015 | $3,521 | $116,667 | $0 | $0 |
| 2014 | $3,521 | $110,000 | $0 | $0 |
Source: Public Records
Map
Nearby Homes
- 11400 Deepwood Dr
- 4719 Ridgeline Terrace Unit 294
- 4634 Deepwood Ct
- 4211 Glenn Dale Rd
- 4811 Lake Ontario Way
- 11108 Maiden Dr
- 10907 Atwell Ave
- 4900 Lisborough Terrace
- 4705 Enterprise Rd
- 11500 Chantilly Ln
- 11400 Chantilly Ln
- 11308 Chantilly Ln
- 10804 Kencrest Dr
- 4615 Morning Glory Trail
- 3712 Baskerville Dr
- 5203 Ashleigh Glen Ct
- 12120 American Chestnut Rd
- 4404 Windflower Way
- 12307 Castlewall Ct
- 10906 Bell Rd
- 11447 Deepwood Dr
- 11453 Deepwood Dr
- 11449 Deepwood Dr
- 11435 Deepwood Dr
- 11451 Deepwood Dr
- 11427 Deepwood Dr
- 11433 Deepwood Dr
- 11429 Deepwood Dr
- 11423 Deepwood Dr
- 11455 Deepwood Dr
- 11445 Deepwood Dr
- 11443 Deepwood Dr
- 11425 Deepwood Dr
- 11421 Deepwood Dr
- 11415 Deepwood Dr
- 11411 Deepwood Dr
- 11411 Deepwood Dr
- 11413 Deepwood Dr
- 11409 Deepwood Dr
- 11403 Deepwood Dr