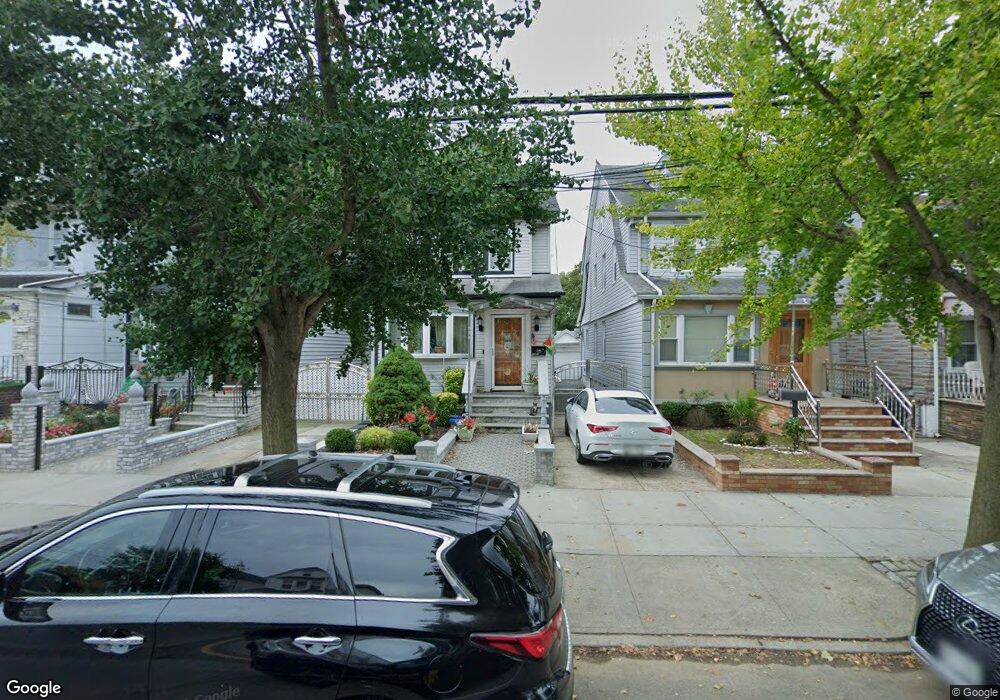
11442 Sutter Ave South Ozone Park, NY 11420
South Ozone Park NeighborhoodEstimated Value: $705,391 - $749,000
--
Bed
--
Bath
1,682
Sq Ft
$436/Sq Ft
Est. Value
About This Home
This home is located at 11442 Sutter Ave, South Ozone Park, NY 11420 and is currently estimated at $733,098, approximately $435 per square foot. 11442 Sutter Ave is a home located in Queens County with nearby schools including P.S. 108 - Capt. Vincent G. Fowler, M.S.137 America's School of Heroes, and John Adams High School.
Ownership History
Date
Name
Owned For
Owner Type
Purchase Details
Closed on
Jan 4, 2008
Sold by
Akbar Mohammad and Salim Bibi N
Bought by
Salim Bibi N
Current Estimated Value
Purchase Details
Closed on
Jul 31, 2002
Sold by
Naraine Kenneth R
Bought by
Salim Bibi N and Akbar Mohammad
Home Financials for this Owner
Home Financials are based on the most recent Mortgage that was taken out on this home.
Original Mortgage
$225,000
Outstanding Balance
$94,118
Interest Rate
6.39%
Estimated Equity
$638,980
Purchase Details
Closed on
Feb 18, 1998
Sold by
Sutter Realty Corp
Bought by
Naraine Kenneth R
Home Financials for this Owner
Home Financials are based on the most recent Mortgage that was taken out on this home.
Original Mortgage
$125,600
Interest Rate
6.92%
Purchase Details
Closed on
Nov 4, 1997
Sold by
Kaiser Barbara Ann and Collins Michael J
Bought by
Sutter Realty Corp
Create a Home Valuation Report for This Property
The Home Valuation Report is an in-depth analysis detailing your home's value as well as a comparison with similar homes in the area
Home Values in the Area
Average Home Value in this Area
Purchase History
| Date | Buyer | Sale Price | Title Company |
|---|---|---|---|
| Salim Bibi N | -- | -- | |
| Salim Bibi N | -- | -- | |
| Naraine Kenneth R | $157,000 | Prestige Title | |
| Sutter Realty Corp | $110,000 | The Title Guarantee Company |
Source: Public Records
Mortgage History
| Date | Status | Borrower | Loan Amount |
|---|---|---|---|
| Open | Salim Bibi N | $225,000 | |
| Previous Owner | Naraine Kenneth R | $125,600 |
Source: Public Records
Tax History Compared to Growth
Tax History
| Year | Tax Paid | Tax Assessment Tax Assessment Total Assessment is a certain percentage of the fair market value that is determined by local assessors to be the total taxable value of land and additions on the property. | Land | Improvement |
|---|---|---|---|---|
| 2025 | $5,936 | $32,659 | $5,645 | $27,014 |
| 2024 | $5,948 | $30,954 | $6,191 | $24,763 |
| 2023 | $5,591 | $29,237 | $4,946 | $24,291 |
| 2022 | $5,292 | $40,260 | $8,100 | $32,160 |
| 2021 | $5,432 | $37,680 | $8,100 | $29,580 |
| 2020 | $4,665 | $35,820 | $8,100 | $27,720 |
| 2019 | $4,303 | $35,640 | $8,100 | $27,540 |
| 2018 | $4,669 | $24,364 | $6,437 | $17,927 |
| 2017 | $4,448 | $23,288 | $6,403 | $16,885 |
| 2016 | $4,224 | $23,288 | $6,403 | $16,885 |
| 2015 | $2,430 | $22,680 | $6,777 | $15,903 |
| 2014 | $2,430 | $21,496 | $7,714 | $13,782 |
Source: Public Records
Map
Nearby Homes
- 114-36 Sutter Ave
- 114-02 Sutter Ave
- 115-35 114th Place
- 13220 114th St
- 115-32 116th St
- 130-55 116th St
- 115-03 115th St
- 114-08 Rockaway Blvd
- 11534 118th St
- 13336 114th Place
- 11401 115th St
- 133-24 118th St
- 112-05 Rockaway Blvd
- 11501 Linden Blvd
- 150 23 117
- 122-30 & 32 134 St
- 115-17 Linden Blvd
- 11140 114th St
- 111-40 114th St
- 111-38 114th St
- 114-44 Sutter Ave
- 11444 Sutter Ave
- 11438 Sutter Ave
- 11446 Sutter Ave
- 11436 Sutter Ave
- 13012 115th St
- 11434 Sutter Ave
- 13014 115th St
- 13014 115th St
- 11432 Sutter Ave
- 13016 115th St
- 13211 114th Place
- 114-38 Sutter Ave
- 13213 114th Place
- 11469 Sutter Ave
- 11430 Sutter Ave
- 13018 115th St
- 132-13 114th Place
- 11502 Sutter Ave
- 13217 114th Place