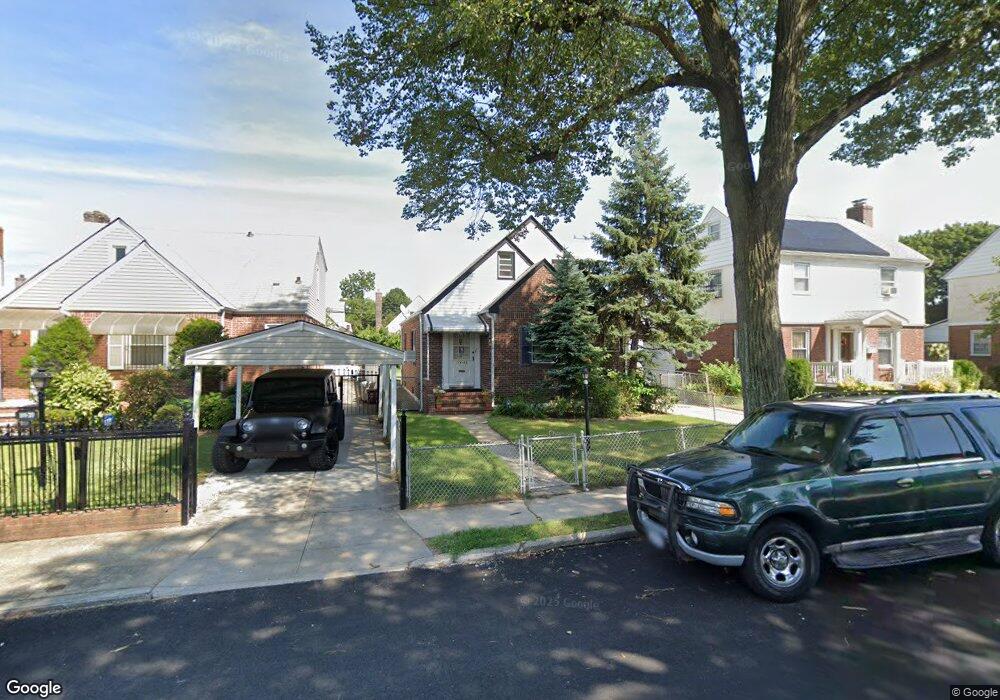
11443 225th St Cambria Heights, NY 11411
Cambria Heights NeighborhoodEstimated Value: $647,072 - $739,000
--
Bed
--
Bath
1,220
Sq Ft
$564/Sq Ft
Est. Value
About This Home
This home is located at 11443 225th St, Cambria Heights, NY 11411 and is currently estimated at $688,018, approximately $563 per square foot. 11443 225th St is a home located in Queens County with nearby schools including P.S./M.S. 147 Ronald Mcnair, I.S. 192 The Linden, and Cambria Center For The Gifted Child.
Ownership History
Date
Name
Owned For
Owner Type
Purchase Details
Closed on
Oct 18, 2002
Sold by
Pashosh Inc
Bought by
Ojomo Clement B and Kema Florence C
Current Estimated Value
Home Financials for this Owner
Home Financials are based on the most recent Mortgage that was taken out on this home.
Original Mortgage
$294,000
Interest Rate
6.34%
Mortgage Type
Purchase Money Mortgage
Purchase Details
Closed on
May 15, 2002
Sold by
Anderson Arthur and Anderson Michelle
Bought by
Pashosh Inc
Home Financials for this Owner
Home Financials are based on the most recent Mortgage that was taken out on this home.
Original Mortgage
$190,000
Interest Rate
6.58%
Purchase Details
Closed on
Mar 31, 1995
Sold by
Springsteen Frances and Reichert Catherine M
Bought by
Anderson Arthur and Anderson Michelle
Home Financials for this Owner
Home Financials are based on the most recent Mortgage that was taken out on this home.
Original Mortgage
$152,350
Interest Rate
8.55%
Mortgage Type
FHA
Create a Home Valuation Report for This Property
The Home Valuation Report is an in-depth analysis detailing your home's value as well as a comparison with similar homes in the area
Home Values in the Area
Average Home Value in this Area
Purchase History
| Date | Buyer | Sale Price | Title Company |
|---|---|---|---|
| Ojomo Clement B | -- | -- | |
| Pashosh Inc | -- | -- | |
| Anderson Arthur | $153,000 | First American Title Ins Co |
Source: Public Records
Mortgage History
| Date | Status | Borrower | Loan Amount |
|---|---|---|---|
| Previous Owner | Ojomo Clement B | $294,000 | |
| Previous Owner | Pashosh Inc | $190,000 | |
| Previous Owner | Anderson Arthur | $152,350 |
Source: Public Records
Tax History Compared to Growth
Tax History
| Year | Tax Paid | Tax Assessment Tax Assessment Total Assessment is a certain percentage of the fair market value that is determined by local assessors to be the total taxable value of land and additions on the property. | Land | Improvement |
|---|---|---|---|---|
| 2025 | $6,365 | $33,178 | $9,340 | $23,838 |
| 2024 | $6,377 | $33,091 | $9,641 | $23,450 |
| 2023 | $6,236 | $32,446 | $9,688 | $22,758 |
| 2022 | $5,914 | $36,420 | $11,520 | $24,900 |
| 2021 | $5,871 | $32,400 | $11,520 | $20,880 |
| 2020 | $5,556 | $35,580 | $11,520 | $24,060 |
| 2019 | $5,476 | $32,760 | $11,520 | $21,240 |
| 2018 | $5,214 | $27,038 | $8,981 | $18,057 |
| 2017 | $4,977 | $25,887 | $11,270 | $14,617 |
| 2016 | $4,572 | $25,887 | $11,270 | $14,617 |
| 2015 | $2,857 | $23,040 | $12,780 | $10,260 |
| 2014 | $2,857 | $22,980 | $12,780 | $10,200 |
Source: Public Records
Map
Nearby Homes
- 114-67 226th St
- 11480 226th St
- 114-66 225th St
- 224-06 114th Rd
- 115-12 227th St
- 114-109 228th St
- 115-40 227th St
- 22343 113th Dr
- 115-47 223rd St
- 22524 Murdock Ave
- 22554 Murdock Ave
- 11552 229th St
- 22324 Murdock Ave
- 225-23 Murdock Ave
- 22533 Murdock Ave
- 225-53 Murdock Ave
- 114-36 220th St
- 115-70 230th St
- 440 Parkway Dr
- 22117 Murdock Ave
- 11439 225th St
- 11447 225th St
- 11435 225th St
- 11435 225th St
- 11451 225th St
- 11444 226th St
- 11440 226th St
- 11448 226th St
- 11444 226th St
- 11444 226th St
- 11431 225th St
- 11452 226th St
- 11436 226th St
- 11457 225th St
- 11456 226th St
- 114-57 225th St
- 11457 225th St Unit 2
- 114-57 225th St Unit 2
- 11432 226th St
- 11448 225th St