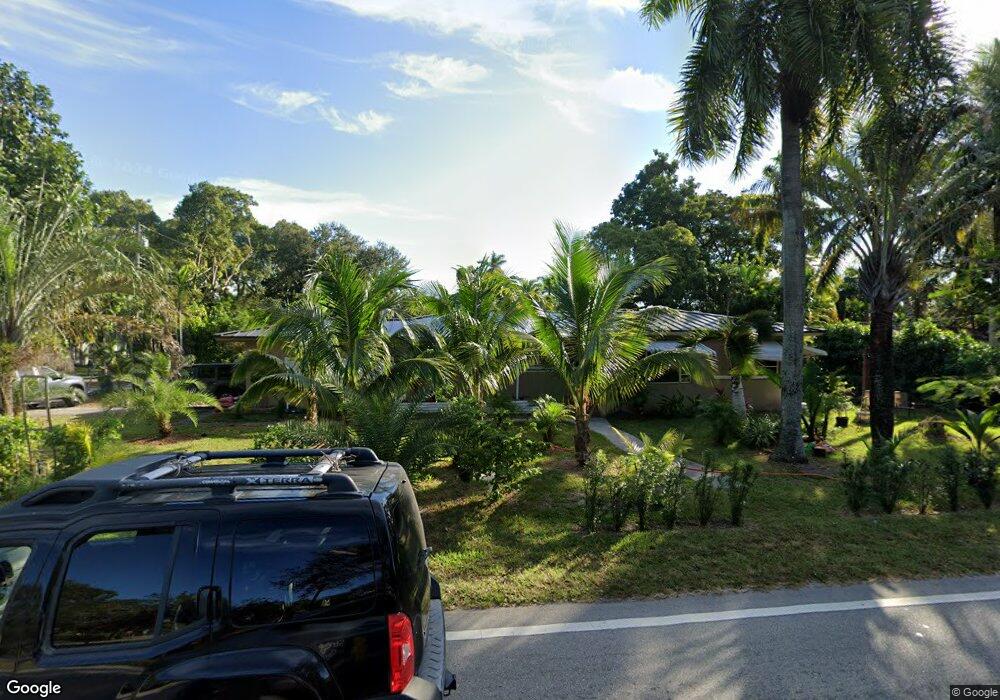
11443 NE 6th Ave Biscayne Park, FL 33161
Estimated Value: $713,000 - $1,100,000
1
Bed
2
Baths
250
Sq Ft
$3,601/Sq Ft
Est. Value
About This Home
This home is located at 11443 NE 6th Ave, Biscayne Park, FL 33161 and is currently estimated at $900,349, approximately $3,601 per square foot. 11443 NE 6th Ave is a home located in Miami-Dade County with nearby schools including Miami Shores Elementary School, North Miami Middle School, and North Miami Senior High School.
Ownership History
Date
Name
Owned For
Owner Type
Purchase Details
Closed on
Feb 20, 2013
Sold by
Roque Marcos Pablo A and Roque Marcos Grisette
Bought by
Marcos Pablo A
Current Estimated Value
Purchase Details
Closed on
Mar 19, 2007
Sold by
Day Christopher W and Pashenko Asya
Bought by
Delpilar Watson Michael and Delpilar Watson Marie
Purchase Details
Closed on
Aug 16, 2005
Sold by
Weir Debrah
Bought by
Roque Marcos Pablo A and Roque Marcos Grisette
Home Financials for this Owner
Home Financials are based on the most recent Mortgage that was taken out on this home.
Original Mortgage
$327,200
Interest Rate
5.75%
Mortgage Type
Unknown
Purchase Details
Closed on
May 1, 2002
Sold by
Marcelo G Addario I
Bought by
Addario Marcelo G and Addario Daniel H
Purchase Details
Closed on
Dec 27, 2001
Sold by
Doris M Weir I
Bought by
Weir Doris M
Create a Home Valuation Report for This Property
The Home Valuation Report is an in-depth analysis detailing your home's value as well as a comparison with similar homes in the area
Home Values in the Area
Average Home Value in this Area
Purchase History
| Date | Buyer | Sale Price | Title Company |
|---|---|---|---|
| Marcos Pablo A | -- | Attorney | |
| Delpilar Watson Michael | $475,000 | Rapid Title Services Co | |
| Roque Marcos Pablo A | $409,000 | Rapid Title Services Co | |
| Addario Marcelo G | -- | -- | |
| Weir Doris M | $100 | -- |
Source: Public Records
Mortgage History
| Date | Status | Borrower | Loan Amount |
|---|---|---|---|
| Previous Owner | Roque Marcos Pablo A | $327,200 |
Source: Public Records
Tax History Compared to Growth
Tax History
| Year | Tax Paid | Tax Assessment Tax Assessment Total Assessment is a certain percentage of the fair market value that is determined by local assessors to be the total taxable value of land and additions on the property. | Land | Improvement |
|---|---|---|---|---|
| 2025 | $9,045 | $392,038 | -- | -- |
| 2024 | $8,842 | $380,990 | -- | -- |
| 2023 | $8,842 | $369,894 | $0 | $0 |
| 2022 | $8,439 | $359,121 | $0 | $0 |
| 2021 | $8,354 | $348,662 | $0 | $0 |
| 2020 | $8,132 | $343,849 | $221,456 | $122,393 |
| 2019 | $9,184 | $343,870 | $221,456 | $122,414 |
| 2018 | $8,755 | $343,892 | $221,456 | $122,436 |
| 2017 | $7,963 | $299,622 | $0 | $0 |
| 2016 | $7,838 | $290,195 | $0 | $0 |
| 2015 | $3,860 | $175,815 | $0 | $0 |
| 2014 | $3,954 | $174,420 | $0 | $0 |
Source: Public Records
Map
Nearby Homes
- 615 NE 115th St
- 515 NE 115th St
- 11504 NE 6th Ave
- 11410 Griffing Blvd
- 646 NE 114th St
- 11377 W Biscayne Canal Rd
- 11530 NE 7th Ave
- 11610 NE 6th Ave
- 11595 W Biscayne Canal Rd
- 11490 W Biscayne Canal Rd
- 665 NE 117th St
- 720 NE 117th St
- 461 NE 115th St
- 11150 Griffing Blvd
- 11412 NE 8th Ave
- 690 NE 118th St
- 425 NE 114th St
- 11701 W Biscayne Canal Rd
- 11660 NE 8th Ave
- 11403 NE 8th Ave
- 610 NE 115th St
- 11433 NE 6 Ave
- 620 NE 115th St
- 625 NE 114th St
- 11401 NE 6th Ave
- 640 NE 115th St
- . NE 6th Ave Unit 1
- 625 NE 115th St
- 11505 NE 6th Ave
- 631 NE 114th St
- 635 NE 115th St
- 650 NE 115th St
- 971 119 Unit 1
- 244 N Vizcayne N Unit 3007
- 11515 NE 6th Ave
- 641 NE 114th St
- 11430 Griffing Blvd
- 645 NE 115th St
- 11525 Griffing Blvd
- 11440 Griffing Blvd