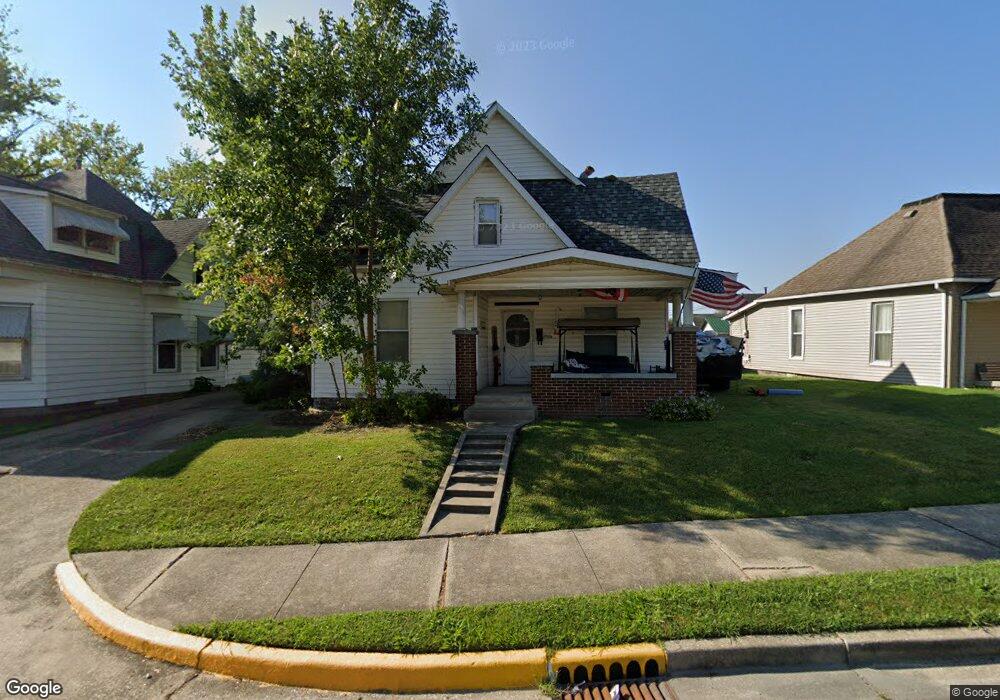
1145 A St NE Linton, IN 47441
Estimated Value: $137,000 - $161,000
3
Beds
2
Baths
1,984
Sq Ft
$75/Sq Ft
Est. Value
About This Home
This home is located at 1145 A St NE, Linton, IN 47441 and is currently estimated at $149,079, approximately $75 per square foot. 1145 A St NE is a home located in Greene County with nearby schools including Linton-Stockton Elementary School, Linton-Stockton Junior High School, and Linton-Stockton High School.
Ownership History
Date
Name
Owned For
Owner Type
Purchase Details
Closed on
Dec 21, 2010
Sold by
White Richard A and White Richard A
Bought by
White Richard A
Current Estimated Value
Home Financials for this Owner
Home Financials are based on the most recent Mortgage that was taken out on this home.
Original Mortgage
$61,457
Interest Rate
4.5%
Mortgage Type
FHA
Purchase Details
Closed on
Apr 9, 2010
Sold by
White Richard A
Bought by
White Richard A and White Carol R
Home Financials for this Owner
Home Financials are based on the most recent Mortgage that was taken out on this home.
Original Mortgage
$58,293
Interest Rate
5.03%
Mortgage Type
Purchase Money Mortgage
Purchase Details
Closed on
Apr 1, 2010
Sold by
White Richard A and White Carol R
Bought by
White Richard A
Home Financials for this Owner
Home Financials are based on the most recent Mortgage that was taken out on this home.
Original Mortgage
$58,293
Interest Rate
5.03%
Mortgage Type
Purchase Money Mortgage
Create a Home Valuation Report for This Property
The Home Valuation Report is an in-depth analysis detailing your home's value as well as a comparison with similar homes in the area
Home Values in the Area
Average Home Value in this Area
Purchase History
| Date | Buyer | Sale Price | Title Company |
|---|---|---|---|
| White Richard A | -- | None Available | |
| White Richard A | -- | None Available | |
| White Richard A | -- | None Available |
Source: Public Records
Mortgage History
| Date | Status | Borrower | Loan Amount |
|---|---|---|---|
| Closed | White Richard A | $61,457 | |
| Closed | White Richard A | $58,293 |
Source: Public Records
Tax History Compared to Growth
Tax History
| Year | Tax Paid | Tax Assessment Tax Assessment Total Assessment is a certain percentage of the fair market value that is determined by local assessors to be the total taxable value of land and additions on the property. | Land | Improvement |
|---|---|---|---|---|
| 2024 | $693 | $68,100 | $5,000 | $63,100 |
| 2023 | $665 | $67,500 | $5,000 | $62,500 |
| 2022 | $590 | $69,500 | $5,000 | $64,500 |
| 2021 | $576 | $64,200 | $5,000 | $59,200 |
| 2020 | $449 | $55,600 | $5,000 | $50,600 |
| 2019 | $477 | $55,600 | $5,000 | $50,600 |
| 2018 | $460 | $55,600 | $5,000 | $50,600 |
| 2017 | $516 | $62,700 | $5,000 | $57,700 |
| 2016 | $483 | $62,000 | $4,900 | $57,100 |
| 2014 | $384 | $55,300 | $4,900 | $50,400 |
| 2013 | -- | $54,800 | $5,000 | $49,800 |
Source: Public Records
Map
Nearby Homes