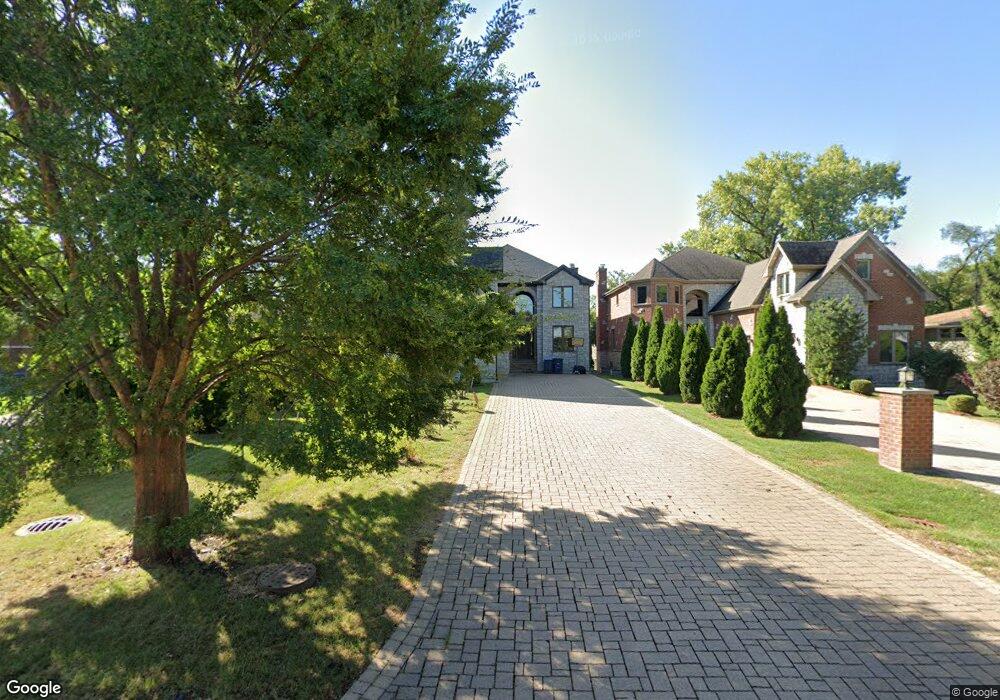
1145 Everett Ln Des Plaines, IL 60018
Estimated Value: $976,453 - $1,284,000
6
Beds
5
Baths
4,350
Sq Ft
$259/Sq Ft
Est. Value
About This Home
This home is located at 1145 Everett Ln, Des Plaines, IL 60018 and is currently estimated at $1,125,613, approximately $258 per square foot. 1145 Everett Ln is a home located in Cook County with nearby schools including Plainfield Elementary School, Algonquin Middle School, and Maine West High School.
Ownership History
Date
Name
Owned For
Owner Type
Purchase Details
Closed on
Feb 6, 2024
Sold by
Clopton Lisa
Bought by
Clopton Jacob C
Current Estimated Value
Purchase Details
Closed on
Sep 11, 2017
Sold by
Kaplan Justin and Kaplan Blair
Bought by
Clopton Jacob C and Clopton Lisa
Home Financials for this Owner
Home Financials are based on the most recent Mortgage that was taken out on this home.
Original Mortgage
$704,425
Interest Rate
3.99%
Mortgage Type
Adjustable Rate Mortgage/ARM
Purchase Details
Closed on
Aug 1, 2013
Sold by
Dabrowski Stanislaw
Bought by
Kaplan Justin and Kaplan Blair
Home Financials for this Owner
Home Financials are based on the most recent Mortgage that was taken out on this home.
Original Mortgage
$416,250
Interest Rate
3.37%
Mortgage Type
New Conventional
Create a Home Valuation Report for This Property
The Home Valuation Report is an in-depth analysis detailing your home's value as well as a comparison with similar homes in the area
Home Values in the Area
Average Home Value in this Area
Purchase History
| Date | Buyer | Sale Price | Title Company |
|---|---|---|---|
| Clopton Jacob C | -- | None Listed On Document | |
| Clopton Jacob C | $741,500 | Altima Title Llc | |
| Kaplan Justin | $585,000 | None Available |
Source: Public Records
Mortgage History
| Date | Status | Borrower | Loan Amount |
|---|---|---|---|
| Previous Owner | Clopton Jacob C | $704,425 | |
| Previous Owner | Kaplan Justin | $416,250 |
Source: Public Records
Tax History
| Year | Tax Paid | Tax Assessment Tax Assessment Total Assessment is a certain percentage of the fair market value that is determined by local assessors to be the total taxable value of land and additions on the property. | Land | Improvement |
|---|---|---|---|---|
| 2025 | $16,242 | $88,257 | $6,346 | $81,911 |
| 2024 | $16,242 | $60,730 | $5,500 | $55,230 |
| 2023 | $15,825 | $64,921 | $5,500 | $59,421 |
| 2022 | $15,825 | $64,921 | $5,500 | $59,421 |
| 2021 | $14,350 | $50,014 | $7,191 | $42,823 |
| 2020 | $14,176 | $50,014 | $7,191 | $42,823 |
| 2019 | $17,048 | $66,776 | $7,191 | $59,585 |
| 2018 | $16,717 | $59,334 | $6,345 | $52,989 |
| 2017 | $16,440 | $59,334 | $6,345 | $52,989 |
| 2016 | $17,837 | $66,688 | $6,345 | $60,343 |
| 2015 | $15,664 | $54,437 | $5,499 | $48,938 |
| 2014 | $15,350 | $54,437 | $5,499 | $48,938 |
| 2013 | -- | $5,499 | $5,499 | $0 |
Source: Public Records
Map
Nearby Homes
- 1080 Bogart St
- 1445 Everett Ave
- 1696 S Elm St
- 815 E Oakton St Unit 311
- 1689 S Elm St
- 1645 Illinois St
- 1370 Fargo Ave Unit E
- 1394 Carol Ln
- 2220 S Chestnut St
- 635 Birchwood Ave
- 664 E Oakton St
- 614 Birchwood Ave
- 1721 Prospect Ave
- 1754 E Lincoln Ave
- 2323 Douglas Ave
- 1700 E Forest Ave
- 1162 W Grant Dr
- 1048 E Walnut Ave
- 1596 Oxford Rd
- 674 E Algonquin Rd
- 1141 Everett Ln
- 1157 Everett Ln
- 1125 Everett Ln
- 1177 Everett Ln
- 1111 Everett Ln
- 1140 Everett Ln
- 1780 Lee St
- 1790 Lee St
- 1160 Everett Ln
- 1126 Everett Ln
- 1095 Everett Ln
- 1172 Everett Ln
- 1766 Lee St
- 1100 Everett Ln
- 1094 Everett Ln
- 1079 Everett Ln
- 1744 Lee St
- 1144 Prospect Ln
- 1154 Prospect Ln
- 1136 Prospect Ln
Your Personal Tour Guide
Ask me questions while you tour the home.