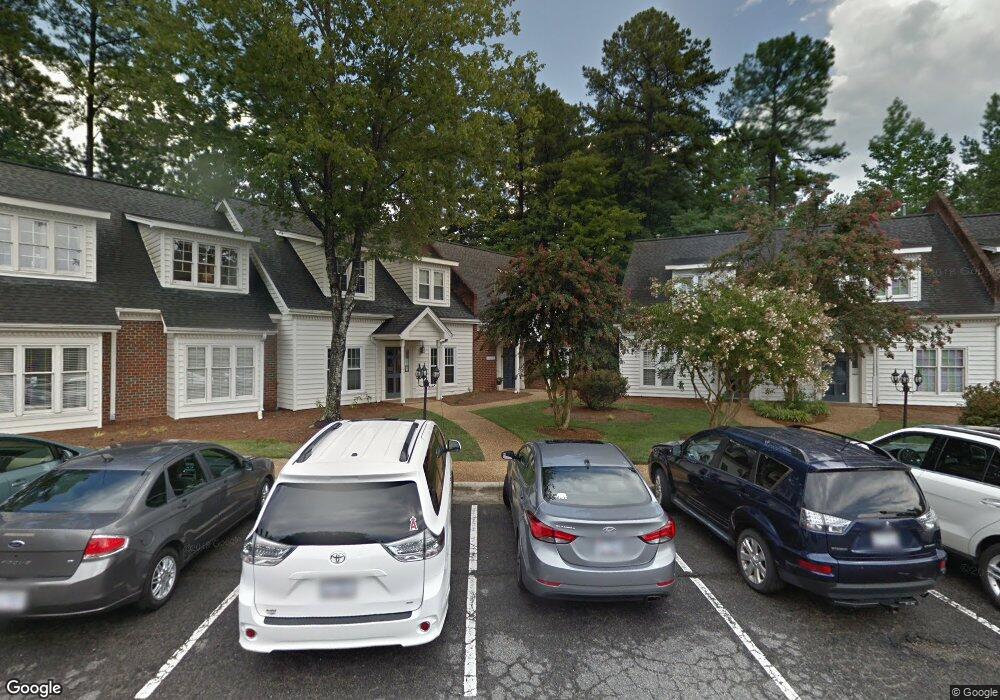
1145 Executive Cir Unit C Cary, NC 27511
South Cary NeighborhoodEstimated Value: $351,468
--
Bed
--
Bath
1,188
Sq Ft
$296/Sq Ft
Est. Value
About This Home
This home is located at 1145 Executive Cir Unit C, Cary, NC 27511 and is currently estimated at $351,468, approximately $295 per square foot. 1145 Executive Cir Unit C is a home located in Wake County with nearby schools including Farmington Woods Elementary, East Cary Middle School, and Cary High School.
Ownership History
Date
Name
Owned For
Owner Type
Purchase Details
Closed on
Jun 17, 2024
Sold by
Alexander Susan B
Bought by
Bull Flag Properties Llc
Current Estimated Value
Home Financials for this Owner
Home Financials are based on the most recent Mortgage that was taken out on this home.
Original Mortgage
$293,250
Outstanding Balance
$289,649
Interest Rate
7.22%
Mortgage Type
New Conventional
Estimated Equity
$61,819
Purchase Details
Closed on
Aug 22, 1997
Bought by
Alexander Susan B
Create a Home Valuation Report for This Property
The Home Valuation Report is an in-depth analysis detailing your home's value as well as a comparison with similar homes in the area
Home Values in the Area
Average Home Value in this Area
Purchase History
| Date | Buyer | Sale Price | Title Company |
|---|---|---|---|
| Bull Flag Properties Llc | $345,000 | None Listed On Document | |
| Alexander Susan B | $125,000 | -- |
Source: Public Records
Mortgage History
| Date | Status | Borrower | Loan Amount |
|---|---|---|---|
| Open | Bull Flag Properties Llc | $293,250 |
Source: Public Records
Tax History Compared to Growth
Tax History
| Year | Tax Paid | Tax Assessment Tax Assessment Total Assessment is a certain percentage of the fair market value that is determined by local assessors to be the total taxable value of land and additions on the property. | Land | Improvement |
|---|---|---|---|---|
| 2025 | -- | $206,185 | $70,000 | $136,185 |
| 2024 | $1,729 | $206,185 | $70,000 | $136,185 |
| 2023 | $1,882 | $188,444 | $70,000 | $118,444 |
| 2022 | $1,811 | $187,791 | $70,000 | $117,791 |
| 2021 | $1,775 | $187,791 | $70,000 | $117,791 |
| 2020 | $1,784 | $187,791 | $70,000 | $117,791 |
| 2019 | $1,972 | $184,171 | $70,000 | $114,171 |
| 2018 | $1,850 | $184,171 | $70,000 | $114,171 |
| 2017 | $1,777 | $184,171 | $70,000 | $114,171 |
| 2016 | $1,751 | $184,171 | $70,000 | $114,171 |
| 2015 | $1,396 | $141,788 | $40,000 | $101,788 |
| 2014 | $1,316 | $141,788 | $40,000 | $101,788 |
Source: Public Records
Map
Nearby Homes
- 915 Ball Field Alley Unit 305
- 915 Ball Field Alley Unit 102
- 915 Ball Field Alley Unit 104
- 915 Ball Field Alley Unit 101
- 104 Eagle Ct
- 124 Twin Oaks Place
- 512 New Kent Place Unit 512
- 210 Twin Oaks Place
- 1305 Hampton Valley Rd
- 103 Kylie Savannah Ct
- 114 Drummond Place
- 135 Drummond Place Unit 7C
- 220 Gordon St
- 1004 Pond St
- 102 Climbing Ivy Ct
- 119 Hanover Place
- 408 Brookcliff Ln
- 111 E Cornwall Rd
- 106 Greenwood Cir
- 122 Clancy Cir
- 1145 Executive Cir
- 1145 Executive Cir Unit E
- 1143 Executive Cir
- 1143 Executive Cir Unit 102
- 1143 Executive Cir Unit 202
- 1143 Executive Cir Unit 103
- 1143 Executive Cir Unit H
- 1143 Executive Cir Unit G
- 1143 Executive Cir Unit B
- 1143 Executive Cir Unit H
- 1143 Executive Cir Unit A
- 1144 Executive Cir
- 1144 Executive Cir Unit 110, 114, 116, 214-2
- 1143 Executive Cir Unit 202
- 1143 Executive Cir Unit 102
- 1143 Executive Cir Unit 103
- 1143 Executive Cir
- 101 Brady Ct
- 107 Brady Ct
- 107 Brady Ct