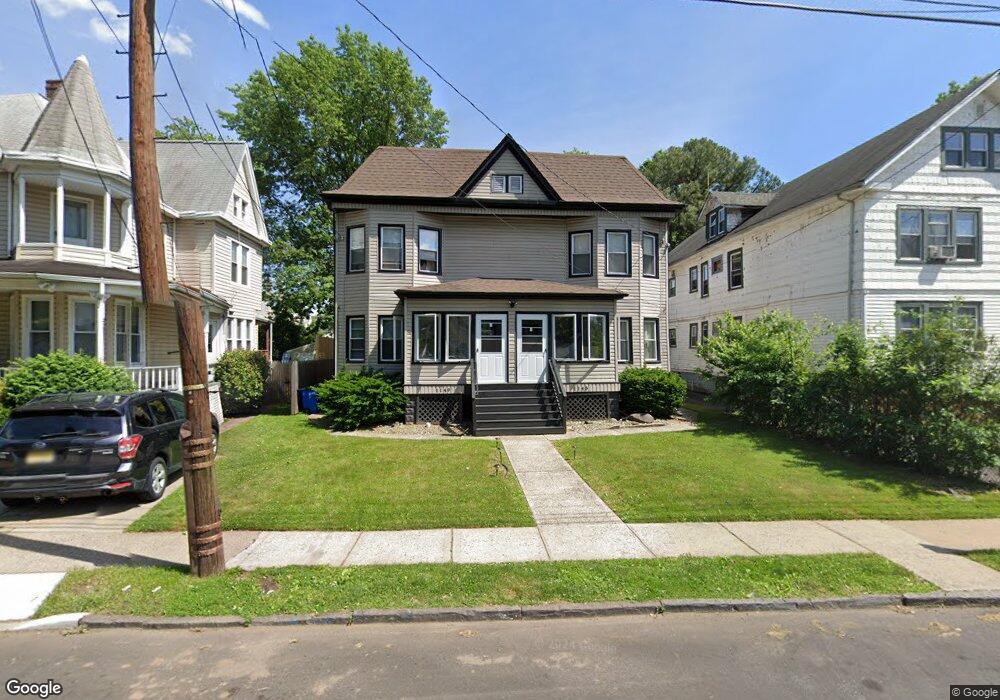
1145 Fulton St Unit 9 Rahway, NJ 07065
Estimated Value: $588,602 - $738,000
3
Beds
2
Baths
2,800
Sq Ft
$235/Sq Ft
Est. Value
About This Home
This home is located at 1145 Fulton St Unit 9, Rahway, NJ 07065 and is currently estimated at $657,651, approximately $234 per square foot. 1145 Fulton St Unit 9 is a home located in Union County with nearby schools including Rahway High School.
Ownership History
Date
Name
Owned For
Owner Type
Purchase Details
Closed on
Jun 30, 2020
Sold by
Homes Ja Llc
Bought by
Vgc Homes Llc
Current Estimated Value
Home Financials for this Owner
Home Financials are based on the most recent Mortgage that was taken out on this home.
Original Mortgage
$243,750
Outstanding Balance
$216,542
Interest Rate
3.2%
Mortgage Type
Commercial
Estimated Equity
$441,109
Purchase Details
Closed on
Apr 22, 2020
Sold by
Us Bank Trust Na
Bought by
Homes Ja Llc
Purchase Details
Closed on
Jun 11, 2019
Sold by
Rashed Zahir
Bought by
U S Bank Trust Na and Lsf11 Master Patricipation Trust
Purchase Details
Closed on
Oct 19, 2004
Sold by
Rashed Hakim
Bought by
Rashed Zahir
Home Financials for this Owner
Home Financials are based on the most recent Mortgage that was taken out on this home.
Original Mortgage
$256,000
Interest Rate
5.75%
Create a Home Valuation Report for This Property
The Home Valuation Report is an in-depth analysis detailing your home's value as well as a comparison with similar homes in the area
Home Values in the Area
Average Home Value in this Area
Purchase History
| Date | Buyer | Sale Price | Title Company |
|---|---|---|---|
| Vgc Homes Llc | $450,000 | Atlantic Title & Settlement | |
| Homes Ja Llc | $279,900 | Coastal Title Agency Inc | |
| U S Bank Trust Na | -- | None Available | |
| Rashed Zahir | $320,000 | -- |
Source: Public Records
Mortgage History
| Date | Status | Borrower | Loan Amount |
|---|---|---|---|
| Open | Vgc Homes Llc | $243,750 | |
| Previous Owner | Rashed Zahir | $256,000 |
Source: Public Records
Tax History Compared to Growth
Tax History
| Year | Tax Paid | Tax Assessment Tax Assessment Total Assessment is a certain percentage of the fair market value that is determined by local assessors to be the total taxable value of land and additions on the property. | Land | Improvement |
|---|---|---|---|---|
| 2025 | $8,560 | $115,600 | $48,800 | $66,800 |
| 2024 | $8,291 | $115,600 | $48,800 | $66,800 |
| 2023 | $8,291 | $115,600 | $48,800 | $66,800 |
| 2022 | $8,117 | $115,600 | $48,800 | $66,800 |
| 2021 | $8,035 | $115,600 | $48,800 | $66,800 |
| 2020 | $8,005 | $115,600 | $48,800 | $66,800 |
| 2019 | $7,904 | $115,600 | $48,800 | $66,800 |
| 2018 | $7,737 | $115,600 | $48,800 | $66,800 |
| 2017 | $7,546 | $115,600 | $48,800 | $66,800 |
| 2016 | $7,386 | $115,600 | $48,800 | $66,800 |
| 2015 | $7,302 | $115,600 | $48,800 | $66,800 |
| 2014 | -- | $115,600 | $48,800 | $66,800 |
Source: Public Records
Map
Nearby Homes
- 1025 New Brunswick Ave
- 245 William St
- 48 W Hazelwood Ave
- 280 E Hazelwood Ave
- 156 W Emerson Ave
- 1016 Jaques Ave
- 139 Maple Ave Unit 104
- 1 Carriage City Plaza Unit 1502
- 1 Carriage City Plaza Unit 1212
- 1 Carriage City Plaza Unit 503
- 935 Thorn St
- 347 E Hazelwood Ave
- 276 E Stearns St
- 163 Stanton St
- 181 W Stearns St
- 91 Elm Ave
- 1427 Barnhardt Ln Unit 502
- 1435 Barnhardt Ln Unit 604
- 182 W Lake Ave
- 653 New Brunswick Ave
- 1145-9 Fulton St
- 1157 Fulton St
- 1137 Fulton St
- 1163 Fulton St
- 1129 Fulton St
- 1171 Fulton St
- 1166 New Brunswick Ave Unit 204
- 1166 New Brunswick Ave Unit A101
- 1166 New Brunswick Ave
- 1166 New Brunswick Ave Unit D401
- 1166 New Brunswick Ave Unit D403
- 1166 New Brunswick Ave Unit D402
- 1166 New Brunswick Ave Unit 304
- 1166 New Brunswick Ave
- 1166 New Brunswick Ave
- 1166 New Brunswick Ave Unit C301
- 1166 New Brunswick Ave Unit B205
- 1166 New Brunswick Ave Unit B203
- 1166 New Brunswick Ave Unit B202
- 1166 New Brunswick Ave Unit B201