1145 Grace St SW Mableton, GA 30126
Estimated Value: $227,000 - $255,459
3
Beds
1
Bath
1,105
Sq Ft
$217/Sq Ft
Est. Value
About This Home
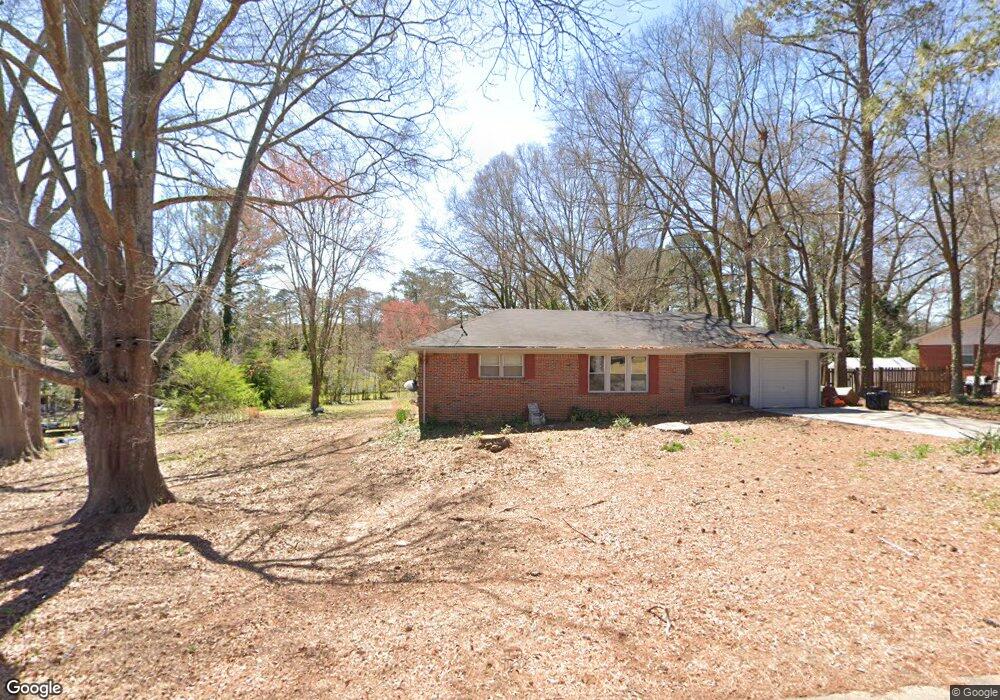
This home is located at 1145 Grace St SW, Mableton, GA 30126 and is currently estimated at $240,115, approximately $217 per square foot. 1145 Grace St SW is a home located in Cobb County with nearby schools including Deerwood Elementary School, Mableton Elementary School, and Floyd Middle School.
Ownership History
Date
Name
Owned For
Owner Type
Purchase Details
Closed on
Apr 15, 2020
Sold by
Koninsky Christopher C
Bought by
Richards Christian Briar
Current Estimated Value
Home Financials for this Owner
Home Financials are based on the most recent Mortgage that was taken out on this home.
Original Mortgage
$88,566
Outstanding Balance
$78,805
Interest Rate
3.75%
Mortgage Type
FHA
Estimated Equity
$161,310
Purchase Details
Closed on
Jul 30, 2012
Sold by
Lubin Jordan E
Bought by
Koninsky Charles P
Purchase Details
Closed on
Jul 1, 2008
Sold by
Trevino David H
Bought by
Residential Funding Comapny
Create a Home Valuation Report for This Property
The Home Valuation Report is an in-depth analysis detailing your home's value as well as a comparison with similar homes in the area
Home Values in the Area
Average Home Value in this Area
Purchase History
| Date | Buyer | Sale Price | Title Company |
|---|---|---|---|
| Richards Christian Briar | $80,000 | None Available | |
| Koninsky Christopher C | -- | None Available | |
| Koninsky Charles P | $32,000 | -- | |
| Residential Funding Comapny | $58,100 | -- |
Source: Public Records
Mortgage History
| Date | Status | Borrower | Loan Amount |
|---|---|---|---|
| Open | Richards Christian Briar | $88,566 |
Source: Public Records
Tax History Compared to Growth
Tax History
| Year | Tax Paid | Tax Assessment Tax Assessment Total Assessment is a certain percentage of the fair market value that is determined by local assessors to be the total taxable value of land and additions on the property. | Land | Improvement |
|---|---|---|---|---|
| 2025 | $2,934 | $97,372 | $18,000 | $79,372 |
| 2024 | $2,936 | $97,372 | $18,000 | $79,372 |
| 2023 | $2,936 | $97,372 | $18,000 | $79,372 |
| 2022 | $971 | $32,000 | $9,600 | $22,400 |
| 2021 | $971 | $32,000 | $9,600 | $22,400 |
| 2020 | $1,044 | $53,408 | $10,000 | $43,408 |
| 2019 | $660 | $35,852 | $6,000 | $29,852 |
| 2018 | $488 | $28,000 | $6,000 | $22,000 |
| 2017 | $478 | $28,000 | $6,000 | $22,000 |
| 2016 | $554 | $31,352 | $6,000 | $25,352 |
| 2015 | $248 | $17,268 | $6,000 | $11,268 |
| 2014 | $251 | $17,268 | $0 | $0 |
Source: Public Records
Map
Nearby Homes
- 1275 Clay Rd SW
- 5527 Andrew Dr SW
- 4397 Treadle Rd SW
- 5205 Silhouette Ln SW
- 1056 Retner Dr SW Unit 3
- 5531 Wild Cherry Dr SW
- 1047 Retner Dr SW
- 814 Glennferry Bend SW
- 826 Glennferry Bend SW
- 4976 Mable Lake Dr SW
- 5477 Blossomwood Trail SW
- 5615 Hislop Ln Unit 82
- 854 Joseph Club Dr SW
- 875 Joseph Club Dr SW
- 0 Brookwood Dr Unit 7577066
- 0 Brookwood Dr Unit 10519191
- 1440 Compton Dr SW
- 1155 Grace St SW
- 1142 Grace St SW
- 1152 Grace St SW
- 1125 Grace St SW
- 1167 Grace St SW
- 1130 Grace St SW
- 1158 Center St SW
- 1148 Center St SW
- 1164 Grace St SW
- 1168 Center St SW
- 1120 Grace St SW
- 1179 Grace St SW
- 1180 Center St SW
- 1130 Center St SW
- 1172 Grace St SW
- 1110 Grace St SW
- 1192 Center St SW
- 1189 Grace St SW
- 1121 Luther Dr SW
- 1133 Luther Dr SW