Estimated Value: $193,365 - $271,000
3
Beds
2
Baths
1,360
Sq Ft
$168/Sq Ft
Est. Value
About This Home
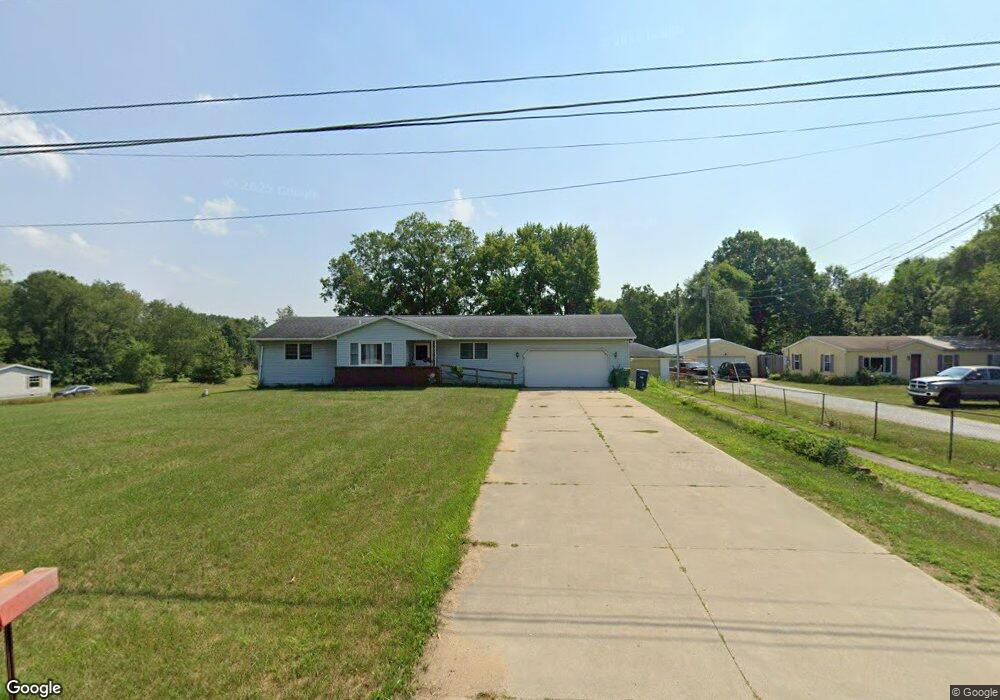
This home is located at 1145 Leet Rd, Niles, MI 49120 and is currently estimated at $227,841, approximately $167 per square foot. 1145 Leet Rd is a home located in Cass County with nearby schools including Howard-Ellis Elementary School, James Ellis School, and Oak Manor Sixth Grade Center.
Ownership History
Date
Name
Owned For
Owner Type
Purchase Details
Closed on
Oct 2, 2024
Sold by
Gamble Ira and Washington Chandree
Bought by
Land Trust and Martinez Law Truste
Current Estimated Value
Purchase Details
Closed on
Jul 12, 2017
Sold by
Gamble Ira and Washington Chandree
Bought by
Gamble Ira and Washington Chandree
Home Financials for this Owner
Home Financials are based on the most recent Mortgage that was taken out on this home.
Original Mortgage
$40,000
Interest Rate
4.03%
Create a Home Valuation Report for This Property
The Home Valuation Report is an in-depth analysis detailing your home's value as well as a comparison with similar homes in the area
Home Values in the Area
Average Home Value in this Area
Purchase History
| Date | Buyer | Sale Price | Title Company |
|---|---|---|---|
| Land Trust | -- | None Listed On Document | |
| Land Trust | -- | None Listed On Document | |
| Gamble Ira | -- | Mtc |
Source: Public Records
Mortgage History
| Date | Status | Borrower | Loan Amount |
|---|---|---|---|
| Previous Owner | Gamble Ira | $40,000 |
Source: Public Records
Tax History Compared to Growth
Tax History
| Year | Tax Paid | Tax Assessment Tax Assessment Total Assessment is a certain percentage of the fair market value that is determined by local assessors to be the total taxable value of land and additions on the property. | Land | Improvement |
|---|---|---|---|---|
| 2025 | $1,909 | $92,800 | $92,800 | $0 |
| 2024 | $770 | $92,000 | $92,000 | $0 |
| 2023 | $735 | $75,600 | $0 | $0 |
| 2022 | $700 | $83,100 | $0 | $0 |
| 2021 | $1,544 | $77,900 | $0 | $0 |
| 2020 | $1,528 | $76,300 | $0 | $0 |
| 2019 | $1,472 | $73,800 | $0 | $0 |
| 2018 | $644 | $66,400 | $0 | $0 |
| 2017 | $631 | $61,800 | $0 | $0 |
| 2016 | $625 | $58,767 | $0 | $0 |
| 2015 | -- | $59,700 | $0 | $0 |
| 2011 | -- | $61,100 | $0 | $0 |
Source: Public Records
Map
Nearby Homes