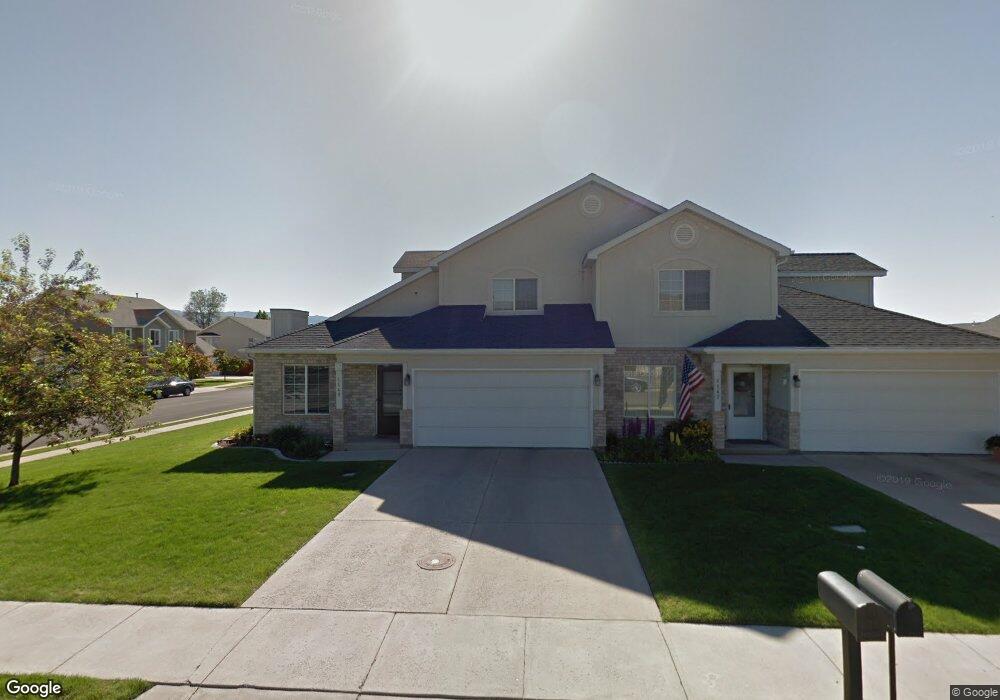
1145 N 320 W Logan, UT 84341
Bridger NeighborhoodEstimated Value: $335,000 - $395,525
3
Beds
2
Baths
1,532
Sq Ft
$232/Sq Ft
Est. Value
About This Home
This home is located at 1145 N 320 W, Logan, UT 84341 and is currently estimated at $355,131, approximately $231 per square foot. 1145 N 320 W is a home located in Cache County with nearby schools including Bridger School, Mount Logan Middle School, and Logan High School.
Ownership History
Date
Name
Owned For
Owner Type
Purchase Details
Closed on
Apr 1, 2020
Sold by
Cazier Lindsey
Bought by
Cazier Lindsey
Current Estimated Value
Home Financials for this Owner
Home Financials are based on the most recent Mortgage that was taken out on this home.
Original Mortgage
$199,700
Outstanding Balance
$176,140
Interest Rate
3.4%
Mortgage Type
New Conventional
Estimated Equity
$178,991
Purchase Details
Closed on
Jun 5, 2019
Sold by
Coleman Valerie Lee
Bought by
Cazier Lindsey
Home Financials for this Owner
Home Financials are based on the most recent Mortgage that was taken out on this home.
Original Mortgage
$199,500
Interest Rate
4.2%
Mortgage Type
New Conventional
Purchase Details
Closed on
Mar 10, 2017
Sold by
Johnson Michelle
Bought by
Coleman Valerie Lee
Home Financials for this Owner
Home Financials are based on the most recent Mortgage that was taken out on this home.
Original Mortgage
$50,000
Interest Rate
4.15%
Mortgage Type
New Conventional
Purchase Details
Closed on
Jan 12, 2016
Sold by
Claflin Jeremy
Bought by
Johnson Michelle
Home Financials for this Owner
Home Financials are based on the most recent Mortgage that was taken out on this home.
Original Mortgage
$150,130
Interest Rate
4.5%
Mortgage Type
FHA
Purchase Details
Closed on
May 3, 2005
Sold by
Johansen Dean G and Johansen Laura H
Bought by
Claflin Jeremy
Home Financials for this Owner
Home Financials are based on the most recent Mortgage that was taken out on this home.
Original Mortgage
$20,550
Interest Rate
5.87%
Mortgage Type
Stand Alone Second
Purchase Details
Closed on
Jun 17, 2002
Sold by
Nuffer Wendy S
Bought by
Johansen Dean G and Johansen Laura H
Home Financials for this Owner
Home Financials are based on the most recent Mortgage that was taken out on this home.
Original Mortgage
$117,946
Interest Rate
6.74%
Mortgage Type
FHA
Create a Home Valuation Report for This Property
The Home Valuation Report is an in-depth analysis detailing your home's value as well as a comparison with similar homes in the area
Home Values in the Area
Average Home Value in this Area
Purchase History
| Date | Buyer | Sale Price | Title Company |
|---|---|---|---|
| Cazier Lindsey | -- | Advanced Title | |
| Cazier Lindsey | -- | American Secure Title Logan | |
| Coleman Valerie Lee | -- | American Secure Title | |
| Johnson Michelle | -- | Cache Title Logan | |
| Claflin Jeremy | -- | Cache Title Company | |
| Johansen Dean G | -- | Cache Title Company |
Source: Public Records
Mortgage History
| Date | Status | Borrower | Loan Amount |
|---|---|---|---|
| Open | Cazier Lindsey | $199,700 | |
| Closed | Cazier Lindsey | $199,500 | |
| Previous Owner | Coleman Valerie Lee | $50,000 | |
| Previous Owner | Johnson Michelle | $150,130 | |
| Previous Owner | Claflin Jeremy | $20,550 | |
| Previous Owner | Claflin Jeremy | $109,600 | |
| Previous Owner | Johansen Dean G | $117,946 |
Source: Public Records
Tax History Compared to Growth
Tax History
| Year | Tax Paid | Tax Assessment Tax Assessment Total Assessment is a certain percentage of the fair market value that is determined by local assessors to be the total taxable value of land and additions on the property. | Land | Improvement |
|---|---|---|---|---|
| 2025 | $1,603 | $376,987 | $132,600 | $244,387 |
| 2024 | $1,655 | $376,987 | $132,600 | $244,387 |
| 2023 | $1,725 | $374,387 | $130,000 | $244,387 |
| 2022 | $1,590 | $322,387 | $78,000 | $244,387 |
| 2021 | $1,367 | $235,510 | $40,000 | $195,510 |
| 2020 | $1,261 | $195,469 | $40,000 | $155,469 |
| 2019 | $1,318 | $195,468 | $40,000 | $155,468 |
| 2018 | $1,294 | $175,190 | $40,000 | $135,190 |
| 2017 | $1,174 | $84,095 | $0 | $0 |
| 2016 | $1,218 | $79,860 | $0 | $0 |
| 2015 | $1,067 | $73,585 | $0 | $0 |
| 2014 | $964 | $73,585 | $0 | $0 |
| 2013 | -- | $73,585 | $0 | $0 |
Source: Public Records
Map
Nearby Homes
- 2200 N 220 W
- 1030 N 130 W Unit 100
- 897 N 250 W
- 894 N 400 W
- 873 N 480 W
- 559 W 1350 N Unit 41
- 430 W 810 N
- 420 W 750 N
- 1515 N 450 W Unit 103
- 514 W 1490 N Unit 102
- 539 W 1465 N Unit 17-102
- 1492 N 565 W Unit 101
- 20 Kings Ct
- 190 Kings Ct
- 365 W 690 N
- 345 W 690 N
- 476 W 725 N
- 190 W 700 N
- 223 W 730 N
- 243 W 730 N