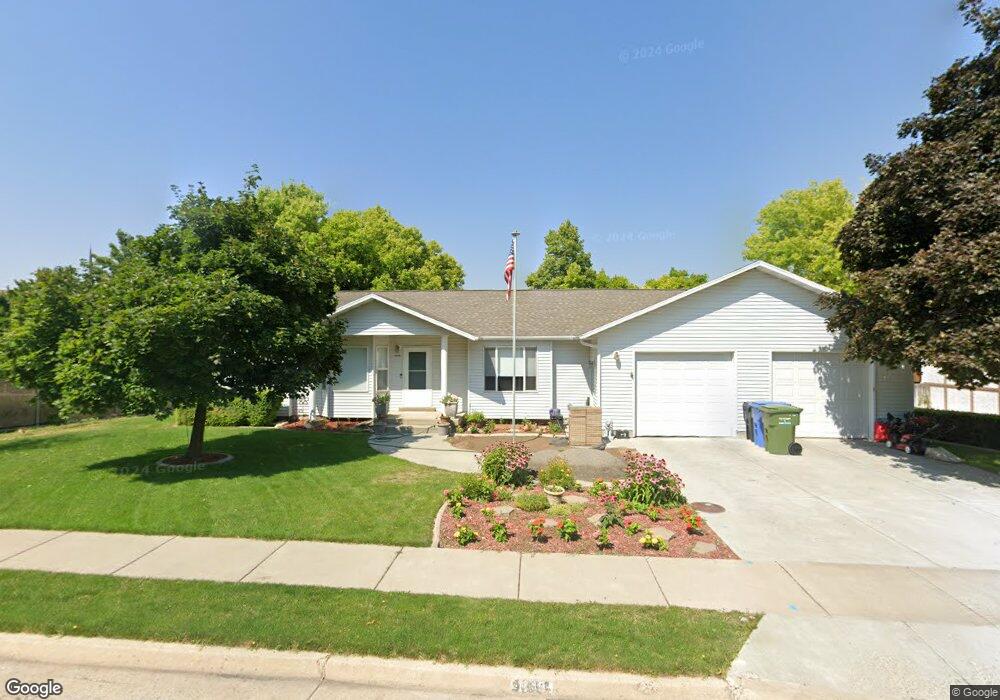
1145 N 680 E Logan, UT 84341
Adams NeighborhoodEstimated Value: $403,094 - $427,000
Studio
--
Bath
1,447
Sq Ft
$288/Sq Ft
Est. Value
About This Home
This home is located at 1145 N 680 E, Logan, UT 84341 and is currently estimated at $416,274, approximately $287 per square foot. 1145 N 680 E is a home with nearby schools including Adams Elementary School, Mount Logan Middle School, and Logan High School.
Ownership History
Date
Name
Owned For
Owner Type
Purchase Details
Closed on
Apr 28, 2025
Sold by
Black Virgil Bruce
Bought by
V Bruce Black Revocable Trust and Black
Current Estimated Value
Purchase Details
Closed on
Jan 8, 2021
Sold by
Black V Bruce V and Black Christina Kayb
Bought by
Black Virgil Bruce
Purchase Details
Closed on
Sep 3, 2020
Sold by
Black V Bruce
Bought by
Black V Bruce V and Black Christina Kaye
Purchase Details
Closed on
Dec 28, 2010
Sold by
Black Debra J
Bought by
Black V Bruce
Create a Home Valuation Report for This Property
The Home Valuation Report is an in-depth analysis detailing your home's value as well as a comparison with similar homes in the area
Home Values in the Area
Average Home Value in this Area
Purchase History
| Date | Buyer | Sale Price | Title Company |
|---|---|---|---|
| V Bruce Black Revocable Trust | -- | None Listed On Document | |
| Black Virgil Bruce | -- | Hickman Land Title Logan | |
| Black V Bruce V | -- | Hickman Land Title Logan | |
| Black V Bruce | -- | None Available |
Source: Public Records
Tax History
| Year | Tax Paid | Tax Assessment Tax Assessment Total Assessment is a certain percentage of the fair market value that is determined by local assessors to be the total taxable value of land and additions on the property. | Land | Improvement |
|---|---|---|---|---|
| 2025 | $1,888 | $244,170 | $0 | $0 |
| 2024 | $1,949 | $244,170 | $0 | $0 |
| 2023 | $2,033 | $242,795 | $0 | $0 |
| 2022 | $1,808 | $201,545 | $0 | $0 |
| 2021 | $1,760 | $303,155 | $50,000 | $253,155 |
| 2020 | $1,666 | $258,219 | $50,000 | $208,219 |
| 2019 | $1,741 | $258,219 | $50,000 | $208,219 |
| 2018 | $1,706 | $231,060 | $50,000 | $181,060 |
| 2017 | $1,618 | $115,830 | $0 | $0 |
| 2016 | $1,677 | $115,830 | $0 | $0 |
| 2015 | $1,502 | $103,580 | $0 | $0 |
| 2014 | $1,357 | $103,580 | $0 | $0 |
| 2013 | -- | $103,580 | $0 | $0 |
Source: Public Records
Map
Nearby Homes
- 1167 N 680 E
- 1177 N 680 E
- 1188 N 600 E
- 633 E 1260 N
- 648 E 1280 N
- 643 E 1280 N
- 1007 Bonneville Ave
- 1238 E Talmage Ln Unit 33
- 1366 N Talmage Ln Unit 35
- 1367 E 1280 N
- 1261 E Talmage Ln Unit 59
- 1241 E Talmage Ln Unit 31
- 1246 E Talmage Ln Unit 32
- 871 N 700 E
- 359 E 1075 N
- 732 N 500 E
- 252 E 1000 N
- 642 E 700 N
- 462 E 700 N
- 395 E 1530 N
Your Personal Tour Guide
Ask me questions while you tour the home.