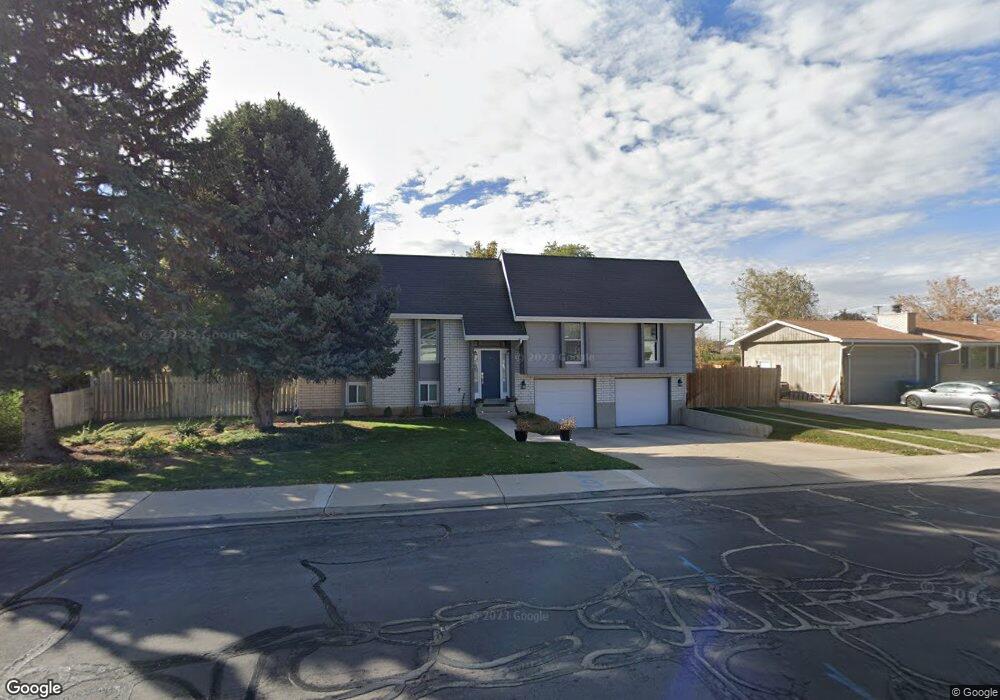
1145 N Main St Orem, UT 84057
Windsor NeighborhoodEstimated Value: $556,000 - $602,711
4
Beds
3
Baths
2,734
Sq Ft
$213/Sq Ft
Est. Value
About This Home
This home is located at 1145 N Main St, Orem, UT 84057 and is currently estimated at $581,904, approximately $212 per square foot. 1145 N Main St is a home located in Utah County with nearby schools including Windsor School, Canyon View Junior High School, and Timpanogos High School.
Ownership History
Date
Name
Owned For
Owner Type
Purchase Details
Closed on
Jun 16, 2014
Sold by
Pb&M Investments Llc
Bought by
Rice Scott and Rice Melissa
Current Estimated Value
Home Financials for this Owner
Home Financials are based on the most recent Mortgage that was taken out on this home.
Original Mortgage
$231,970
Outstanding Balance
$173,406
Interest Rate
3.75%
Mortgage Type
FHA
Estimated Equity
$408,498
Purchase Details
Closed on
Dec 31, 2013
Sold by
Leavitt Michael D and Leavitt Shelly L
Bought by
Pb & M Investments Llc
Purchase Details
Closed on
Sep 9, 1998
Sold by
Leavitt Shelly Lynn and Leavitt Michael Dee
Bought by
Leavitt Michael D and Leavitt Shelly L
Home Financials for this Owner
Home Financials are based on the most recent Mortgage that was taken out on this home.
Original Mortgage
$123,000
Interest Rate
6.92%
Create a Home Valuation Report for This Property
The Home Valuation Report is an in-depth analysis detailing your home's value as well as a comparison with similar homes in the area
Home Values in the Area
Average Home Value in this Area
Purchase History
| Date | Buyer | Sale Price | Title Company |
|---|---|---|---|
| Rice Scott | -- | Title West | |
| Pb & M Investments Llc | $148,100 | Etitle Insurance Agency | |
| Leavitt Michael D | -- | -- |
Source: Public Records
Mortgage History
| Date | Status | Borrower | Loan Amount |
|---|---|---|---|
| Open | Rice Scott | $231,970 | |
| Previous Owner | Leavitt Michael D | $123,000 |
Source: Public Records
Tax History
| Year | Tax Paid | Tax Assessment Tax Assessment Total Assessment is a certain percentage of the fair market value that is determined by local assessors to be the total taxable value of land and additions on the property. | Land | Improvement |
|---|---|---|---|---|
| 2025 | $2,503 | $317,955 | -- | -- |
| 2024 | $2,503 | $306,075 | $0 | $0 |
| 2023 | $2,309 | $303,490 | $0 | $0 |
| 2022 | $2,251 | $286,550 | $0 | $0 |
| 2021 | $1,920 | $370,300 | $148,800 | $221,500 |
| 2020 | $1,774 | $336,200 | $119,000 | $217,200 |
| 2019 | $1,610 | $317,400 | $107,800 | $209,600 |
| 2018 | $1,553 | $292,500 | $104,100 | $188,400 |
| 2017 | $1,463 | $147,565 | $0 | $0 |
| 2016 | $1,481 | $137,775 | $0 | $0 |
| 2015 | $1,408 | $123,860 | $0 | $0 |
| 2014 | $1,260 | $110,385 | $0 | $0 |
Source: Public Records
Map
Nearby Homes
- 16 E 925 N
- 917 N Garden Dr
- 125 W 870 N
- 1371 N 330 E Unit 8
- 372 E 1165 N
- 287 W 1380 N
- 363 E 1395 N Unit 22
- 789 200 E Unit 787
- 332 W Amiron Way Unit D
- 362 E 800 N Unit 1
- 1480 N 430 E
- 1548 N 275 West St Unit 2
- 1461 N Amiron Way Unit B
- 1566 N 275 West St Unit 1
- 1547 N 275 West St Unit 5
- 1638 N 160 E
- 1636 N 160 E
- 620 N 120 E
- 538 W 1120 N
- 976 N 560 E
Your Personal Tour Guide
Ask me questions while you tour the home.