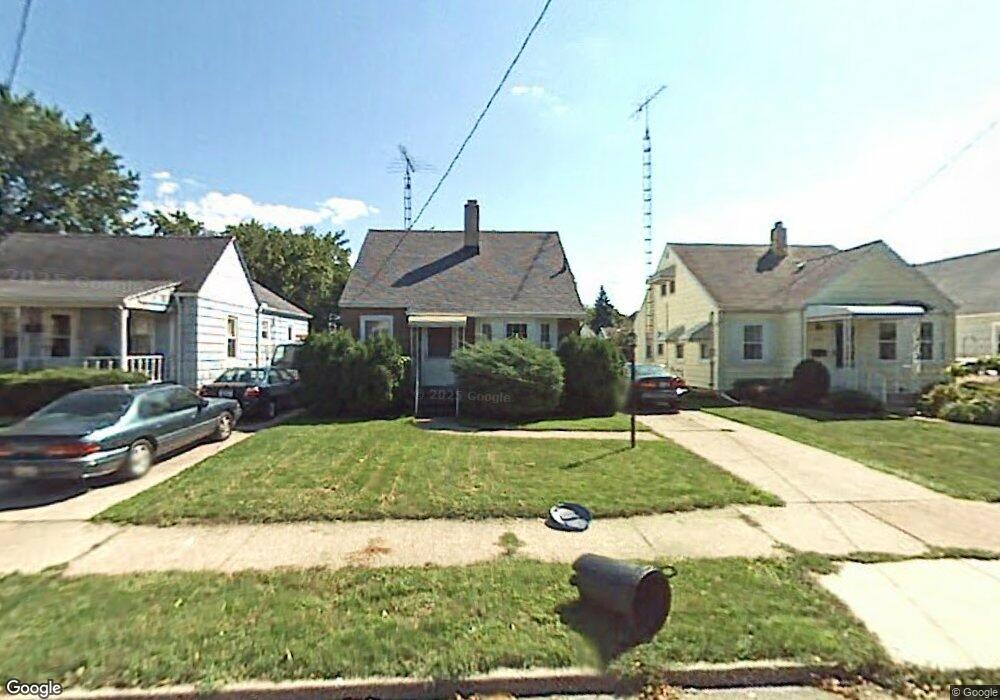
1145 Olson St Toledo, OH 43612
Five Points NeighborhoodEstimated Value: $107,000 - $118,000
2
Beds
1
Bath
1,014
Sq Ft
$111/Sq Ft
Est. Value
About This Home
This home is located at 1145 Olson St, Toledo, OH 43612 and is currently estimated at $112,847, approximately $111 per square foot. 1145 Olson St is a home located in Lucas County with nearby schools including Larchmont Elementary School, Start High School, and Bennett Venture Academy.
Ownership History
Date
Name
Owned For
Owner Type
Purchase Details
Closed on
Jul 24, 2006
Sold by
Jpmorgan Chase Bank
Bought by
Mcclory April
Current Estimated Value
Home Financials for this Owner
Home Financials are based on the most recent Mortgage that was taken out on this home.
Original Mortgage
$66,400
Outstanding Balance
$39,702
Interest Rate
6.78%
Mortgage Type
Purchase Money Mortgage
Estimated Equity
$73,145
Purchase Details
Closed on
Dec 8, 2005
Sold by
Gray Milton C
Bought by
Jpmorgan Chase Bank
Purchase Details
Closed on
Aug 29, 2003
Sold by
Bernhardt Betty E
Bought by
Gray Milton C
Home Financials for this Owner
Home Financials are based on the most recent Mortgage that was taken out on this home.
Original Mortgage
$89,995
Interest Rate
6.95%
Mortgage Type
Purchase Money Mortgage
Purchase Details
Closed on
Sep 8, 1998
Sold by
Bernhardt Betty E
Bought by
Bernhardt Betty E and Betty E Bernhardt Trust
Purchase Details
Closed on
Mar 16, 1988
Sold by
Bernhardt A E and B E
Create a Home Valuation Report for This Property
The Home Valuation Report is an in-depth analysis detailing your home's value as well as a comparison with similar homes in the area
Home Values in the Area
Average Home Value in this Area
Purchase History
| Date | Buyer | Sale Price | Title Company |
|---|---|---|---|
| Mcclory April | $69,900 | Nova Title Agency | |
| Jpmorgan Chase Bank | $60,000 | None Available | |
| Gray Milton C | $90,500 | Northwest Title Agency Of Oh | |
| Bernhardt Betty E | -- | -- | |
| -- | -- | -- |
Source: Public Records
Mortgage History
| Date | Status | Borrower | Loan Amount |
|---|---|---|---|
| Open | Mcclory April | $66,400 | |
| Previous Owner | Gray Milton C | $89,995 |
Source: Public Records
Tax History Compared to Growth
Tax History
| Year | Tax Paid | Tax Assessment Tax Assessment Total Assessment is a certain percentage of the fair market value that is determined by local assessors to be the total taxable value of land and additions on the property. | Land | Improvement |
|---|---|---|---|---|
| 2024 | $747 | $24,080 | $8,260 | $15,820 |
| 2023 | $1,190 | $18,095 | $7,035 | $11,060 |
| 2022 | $1,194 | $18,095 | $7,035 | $11,060 |
| 2021 | $1,222 | $18,095 | $7,035 | $11,060 |
| 2020 | $1,332 | $17,535 | $6,545 | $10,990 |
| 2019 | $1,294 | $17,535 | $6,545 | $10,990 |
| 2018 | $1,301 | $17,535 | $6,545 | $10,990 |
| 2017 | $1,332 | $17,150 | $6,405 | $10,745 |
| 2016 | $1,334 | $49,000 | $18,300 | $30,700 |
| 2015 | $1,323 | $49,000 | $18,300 | $30,700 |
| 2014 | $1,079 | $17,160 | $6,410 | $10,750 |
| 2013 | $1,079 | $17,160 | $6,410 | $10,750 |
Source: Public Records
Map
Nearby Homes
- 1126 Slater St
- 1044 Hawk St
- 1308 Crestwood Rd
- 4612 Willys Pkwy
- 5061 Hallgate Ave
- 4623 Lewis Ave
- 4526 Eastway St
- 1351 Corbin Rd
- 904 Annabelle Dr
- 826 W Gramercy Ave
- 5145 Ford Ave
- 943 Cloverdale Rd
- 829 Brinton Dr
- 743 W Gramercy Ave
- 4531 Walker Ave
- 706 W Gramercy Ave
- 4703 Vermaas Ave
- 4444 Bellevista Dr
- 4419 Lewis Ave
- 1416 Sabra Rd