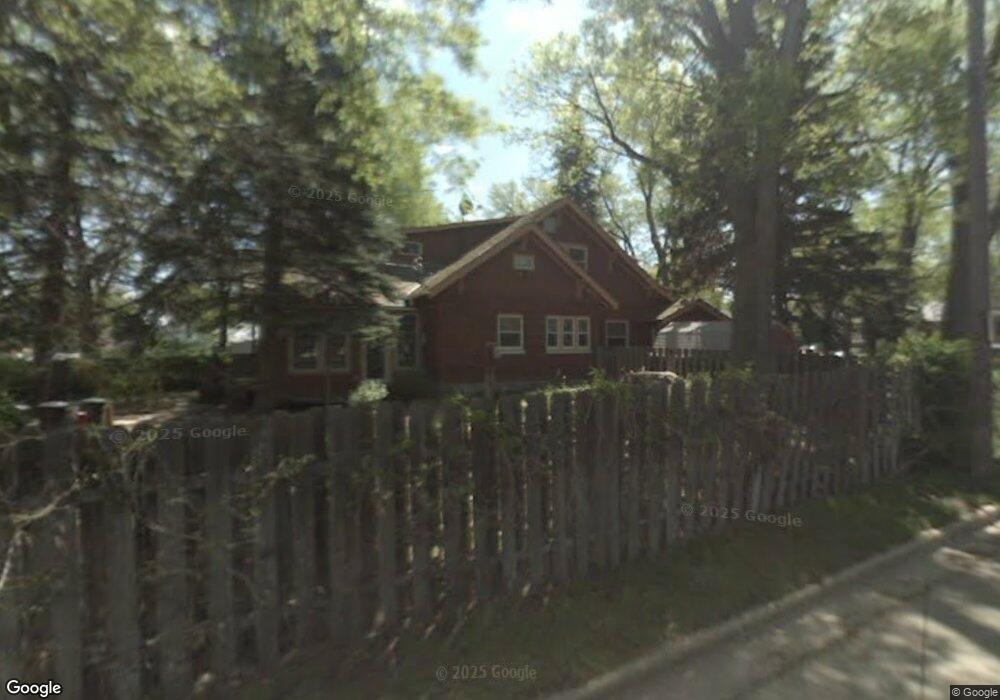
1145 S F St Broken Bow, NE 68822
Estimated Value: $240,000 - $273,000
--
Bed
2
Baths
2,641
Sq Ft
$97/Sq Ft
Est. Value
About This Home
This home is located at 1145 S F St, Broken Bow, NE 68822 and is currently estimated at $255,302, approximately $96 per square foot. 1145 S F St is a home located in Custer County with nearby schools including North Park Elementary School, Broken Bow Junior High School, and Broken Bow High School.
Ownership History
Date
Name
Owned For
Owner Type
Purchase Details
Closed on
Apr 9, 2015
Sold by
Middlemas Matthew M and Middlemas Sonya S
Bought by
Clark Brent E and Clark Hailee R
Current Estimated Value
Purchase Details
Closed on
Feb 28, 2013
Sold by
Coleman Ryan W and Coleman Marilyn L
Bought by
Middlemas Matthew M and Middlemas Sonya S
Purchase Details
Closed on
Oct 26, 2009
Sold by
Wooden Steven Ray and Wooden Wife
Bought by
Coleman Ryan W and Coleman Marilyn L
Create a Home Valuation Report for This Property
The Home Valuation Report is an in-depth analysis detailing your home's value as well as a comparison with similar homes in the area
Home Values in the Area
Average Home Value in this Area
Purchase History
| Date | Buyer | Sale Price | Title Company |
|---|---|---|---|
| Clark Brent E | $157,900 | -- | |
| Middlemas Matthew M | $145,000 | -- | |
| Coleman Ryan W | $99,900 | -- |
Source: Public Records
Tax History Compared to Growth
Tax History
| Year | Tax Paid | Tax Assessment Tax Assessment Total Assessment is a certain percentage of the fair market value that is determined by local assessors to be the total taxable value of land and additions on the property. | Land | Improvement |
|---|---|---|---|---|
| 2025 | $3,064 | $272,087 | $8,184 | $263,903 |
| 2024 | $3,064 | $225,789 | $8,184 | $217,605 |
| 2023 | $3,400 | $217,018 | $8,184 | $208,834 |
| 2022 | $3,932 | $214,221 | $8,184 | $206,037 |
| 2021 | $3,829 | $213,477 | $7,440 | $206,037 |
| 2020 | $3,797 | $213,477 | $7,440 | $206,037 |
| 2019 | $2,779 | $156,509 | $5,581 | $150,928 |
| 2017 | $2,557 | $140,047 | $5,581 | $134,466 |
| 2016 | $2,760 | $138,112 | $3,646 | $134,466 |
| 2015 | $2,168 | $107,549 | $3,603 | $103,946 |
| 2014 | $2,168 | $97,772 | $3,275 | $94,497 |
Source: Public Records
Map
Nearby Homes