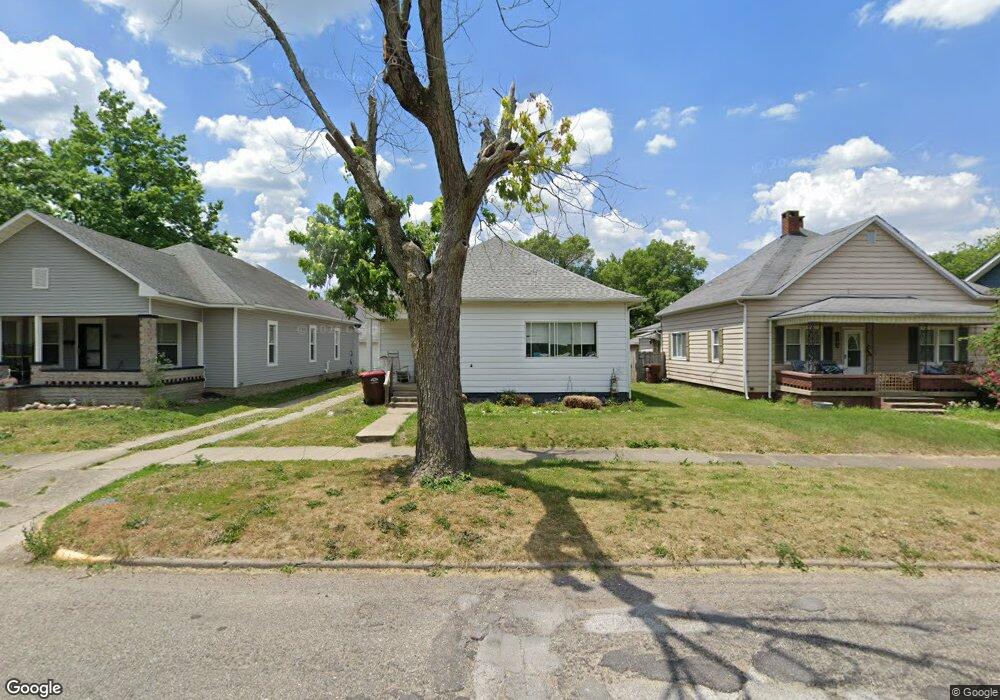
1145 S Main St Clinton, IN 47842
Estimated Value: $92,000 - $95,000
2
Beds
1
Bath
1,246
Sq Ft
$75/Sq Ft
Est. Value
About This Home
This home is located at 1145 S Main St, Clinton, IN 47842 and is currently estimated at $93,500, approximately $75 per square foot. 1145 S Main St is a home with nearby schools including South Vermillion High School and Sacred Heart School.
Ownership History
Date
Name
Owned For
Owner Type
Purchase Details
Closed on
Oct 5, 2022
Sold by
Avenatti Anthony J
Bought by
Adams Property Management Llc
Current Estimated Value
Home Financials for this Owner
Home Financials are based on the most recent Mortgage that was taken out on this home.
Original Mortgage
$170,000
Outstanding Balance
$145,839
Interest Rate
4.85%
Mortgage Type
Credit Line Revolving
Estimated Equity
-$52,339
Purchase Details
Closed on
Aug 18, 2014
Sold by
Juvinall Tracy L
Bought by
Juvinall Tracy L
Create a Home Valuation Report for This Property
The Home Valuation Report is an in-depth analysis detailing your home's value as well as a comparison with similar homes in the area
Home Values in the Area
Average Home Value in this Area
Purchase History
| Date | Buyer | Sale Price | Title Company |
|---|---|---|---|
| Adams Property Management Llc | -- | None Listed On Document | |
| Avenatti Anthony J | -- | None Listed On Document | |
| Juvinall Tracy L | -- | -- |
Source: Public Records
Mortgage History
| Date | Status | Borrower | Loan Amount |
|---|---|---|---|
| Open | Adams Property Management Llc | $170,000 |
Source: Public Records
Tax History Compared to Growth
Tax History
| Year | Tax Paid | Tax Assessment Tax Assessment Total Assessment is a certain percentage of the fair market value that is determined by local assessors to be the total taxable value of land and additions on the property. | Land | Improvement |
|---|---|---|---|---|
| 2024 | $1,042 | $52,100 | $11,700 | $40,400 |
| 2023 | $2,510 | $86,500 | $11,700 | $74,800 |
| 2022 | $684 | $34,200 | $6,300 | $27,900 |
| 2021 | $684 | $34,200 | $6,300 | $27,900 |
| 2020 | $684 | $34,200 | $6,300 | $27,900 |
| 2019 | $684 | $34,200 | $6,300 | $27,900 |
| 2018 | $684 | $34,200 | $6,300 | $27,900 |
| 2017 | $684 | $34,200 | $6,300 | $27,900 |
| 2016 | $684 | $34,200 | $6,300 | $27,900 |
| 2014 | $684 | $34,200 | $6,300 | $27,900 |
| 2013 | $684 | $47,400 | $6,300 | $41,100 |
Source: Public Records
Map
Nearby Homes
- 0 S Main St
- 947 S Main St
- 1409 S 4th St
- 1025 S 6th St
- 734 S 6th St
- 1400 S 8th St
- 525 S 4th St
- 660 Mulberry St
- 559 Mulberry St
- 1059 Blackman St
- 1146 Blackman St
- 359 N 3rd St
- 2359 E St Rd 163
- 522 N Main St
- 821 N 8th St
- 15034 S Willow Grove Ave
- 945 Morey St
- 1102 Matthews St
- 1108 W Ewing St
- 1162 W Ewing St