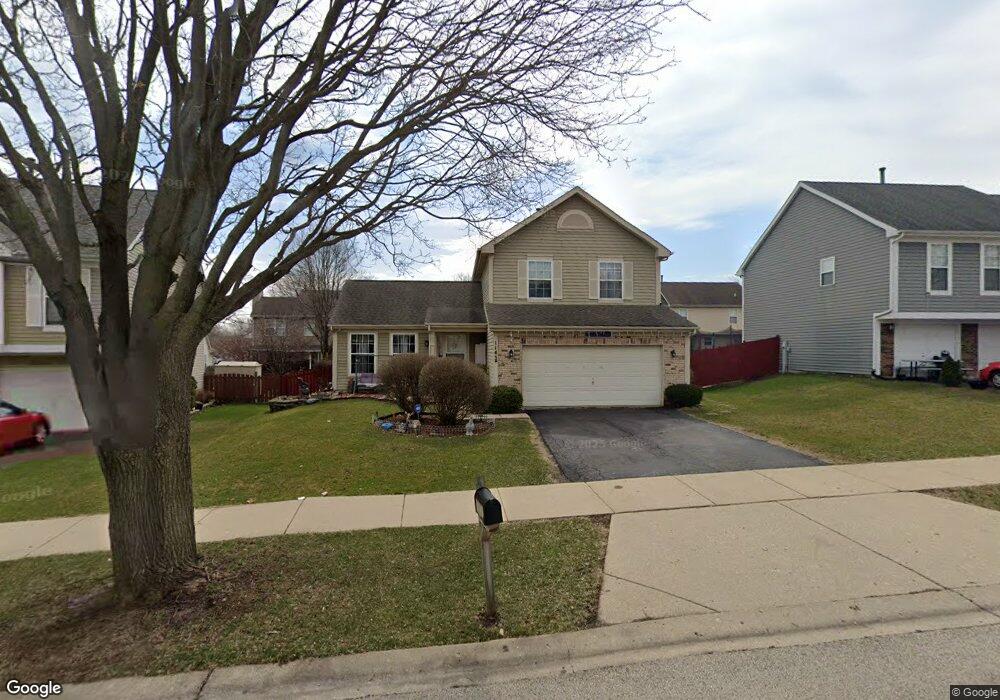
1145 Spring Creek Rd Elgin, IL 60120
Cobblers Crossing NeighborhoodEstimated Value: $362,565 - $459,000
3
Beds
2
Baths
1,618
Sq Ft
$246/Sq Ft
Est. Value
About This Home
This home is located at 1145 Spring Creek Rd, Elgin, IL 60120 and is currently estimated at $397,391, approximately $245 per square foot. 1145 Spring Creek Rd is a home located in Cook County with nearby schools including Lincoln Elementary School, Larsen Middle School, and Elgin High School.
Ownership History
Date
Name
Owned For
Owner Type
Purchase Details
Closed on
May 28, 2021
Sold by
Ahmedyar Sudaba and Ahmedya Omaid
Bought by
Ahmedyar Sudaba and Ahmedyar Omaid
Current Estimated Value
Home Financials for this Owner
Home Financials are based on the most recent Mortgage that was taken out on this home.
Original Mortgage
$238,200
Outstanding Balance
$215,013
Interest Rate
3.25%
Mortgage Type
New Conventional
Estimated Equity
$182,378
Purchase Details
Closed on
Jul 5, 2018
Sold by
Benson Ronald T
Bought by
Ahmedyar Sudaba and Rahimi Omaid
Home Financials for this Owner
Home Financials are based on the most recent Mortgage that was taken out on this home.
Original Mortgage
$242,500
Interest Rate
4.87%
Mortgage Type
New Conventional
Purchase Details
Closed on
Jul 28, 2000
Sold by
Tejera Carl and Tejera Leigh Ann
Bought by
Benson Ronald I and Miller Joyce
Home Financials for this Owner
Home Financials are based on the most recent Mortgage that was taken out on this home.
Original Mortgage
$119,600
Interest Rate
8.16%
Create a Home Valuation Report for This Property
The Home Valuation Report is an in-depth analysis detailing your home's value as well as a comparison with similar homes in the area
Home Values in the Area
Average Home Value in this Area
Purchase History
| Date | Buyer | Sale Price | Title Company |
|---|---|---|---|
| Ahmedyar Sudaba | -- | First American Title | |
| Ahmedyar Sudaba | $250,000 | Old Republic Title | |
| Benson Ronald I | $184,000 | -- |
Source: Public Records
Mortgage History
| Date | Status | Borrower | Loan Amount |
|---|---|---|---|
| Open | Ahmedyar Sudaba | $238,200 | |
| Previous Owner | Ahmedyar Sudaba | $242,500 | |
| Previous Owner | Benson Ronald I | $119,600 |
Source: Public Records
Tax History
| Year | Tax Paid | Tax Assessment Tax Assessment Total Assessment is a certain percentage of the fair market value that is determined by local assessors to be the total taxable value of land and additions on the property. | Land | Improvement |
|---|---|---|---|---|
| 2025 | $7,105 | $35,000 | $5,393 | $29,607 |
| 2024 | $7,105 | $28,000 | $4,719 | $23,281 |
| 2023 | $6,876 | $28,000 | $4,719 | $23,281 |
| 2022 | $6,876 | $28,000 | $4,719 | $23,281 |
| 2021 | $6,020 | $20,799 | $3,033 | $17,766 |
| 2020 | $6,060 | $20,799 | $3,033 | $17,766 |
| 2019 | $7,083 | $23,110 | $3,033 | $20,077 |
| 2018 | $6,188 | $18,213 | $2,696 | $15,517 |
| 2017 | $3,094 | $18,213 | $2,696 | $15,517 |
| 2016 | $4,440 | $18,213 | $2,696 | $15,517 |
| 2015 | $4,354 | $16,889 | $2,359 | $14,530 |
| 2014 | $4,733 | $18,312 | $2,359 | $15,953 |
| 2013 | $4,543 | $18,312 | $2,359 | $15,953 |
Source: Public Records
Map
Nearby Homes
- 1139 Ironwood Ct
- Vacant Lot Parcel 1 Congdon Ave
- 1190 Alpine Ln
- 6131 Canterbury Ln Unit 281
- 1200 Deep Woods Dr
- 860 Parkway Ave
- 6085 Irene Dr
- 796 Parkway Ave
- 1812 Kelberg Ave Unit 482
- 1590 Russell Dr
- 1870 Hampshire Dr
- 1089 Quaker Hill Ct Unit 711
- 1409 Dundee Ave
- 616 Glenwood Ave
- 600 Countryfield Ln
- 1127 Morton Ave
- 1154 Pegwood Dr
- 501 Glenwood Trail
- 601 Columbia Ave
- 1020 Hill Ave
- 1149 Spring Creek Rd
- 1141 Spring Creek Rd
- 1044 Clover Hill Ln
- 1048 Clover Hill Ln Unit 7
- 1040 Clover Hill Ln
- 1153 Spring Creek Rd
- 1150 Spring Creek Rd
- 1140 Spring Creek Rd Unit 8
- 1056 Clover Hill Ln
- 1160 Spring Creek Rd
- 1060 Clover Hill Ln
- 1160 Cobblers Crossing
- 1150 Cobblers Crossing
- 1195 Cobblers Crossing Unit 8
- 1045 Clover Hill Ln Unit 7
- 1165 Spring Creek Rd
- 1049 Clover Hill Ln
- 1075 Ironwood Dr
- 1041 Clover Hill Ln
- 1064 Clover Hill Ln
Your Personal Tour Guide
Ask me questions while you tour the home.