11450 Abbey Ln SW Port Orchard, WA 98367
Estimated Value: $726,000 - $831,000
3
Beds
2
Baths
1,344
Sq Ft
$575/Sq Ft
Est. Value
About This Home
This home is located at 11450 Abbey Ln SW, Port Orchard, WA 98367 and is currently estimated at $772,700, approximately $574 per square foot. 11450 Abbey Ln SW is a home with nearby schools including Burley Glenwood Elementary School, Cedar Heights Middle School, and South Kitsap High School.
Ownership History
Date
Name
Owned For
Owner Type
Purchase Details
Closed on
Dec 17, 2019
Sold by
Weight Gregory J and Weight Ami L
Bought by
Weight Gregory James and Weight Ami Lynn
Current Estimated Value
Purchase Details
Closed on
Jan 31, 1997
Sold by
Terwilligar Gary L and Terwilligar Geri L
Bought by
Weight Gregory J and Weight Ami L
Home Financials for this Owner
Home Financials are based on the most recent Mortgage that was taken out on this home.
Original Mortgage
$71,887
Outstanding Balance
$8,200
Interest Rate
7.66%
Mortgage Type
VA
Estimated Equity
$764,500
Purchase Details
Closed on
Sep 6, 1996
Sold by
Smith James O and Smith Maxine
Bought by
Terwillegar Gary L and Terwillegar Geri L
Purchase Details
Closed on
Dec 18, 1995
Sold by
Smith James O and Smith Maxine
Bought by
Terwillegar Gary L and Terwillegar Geri L
Home Financials for this Owner
Home Financials are based on the most recent Mortgage that was taken out on this home.
Original Mortgage
$25,500
Interest Rate
10%
Create a Home Valuation Report for This Property
The Home Valuation Report is an in-depth analysis detailing your home's value as well as a comparison with similar homes in the area
Home Values in the Area
Average Home Value in this Area
Purchase History
| Date | Buyer | Sale Price | Title Company |
|---|---|---|---|
| Weight Gregory James | -- | None Available | |
| Weight Gregory J | $81,000 | Stewart Title Co | |
| Terwillegar Gary L | -- | Commonwealth Land Title Ins | |
| Terwillegar Gary L | $30,000 | Stewart Title Company |
Source: Public Records
Mortgage History
| Date | Status | Borrower | Loan Amount |
|---|---|---|---|
| Open | Weight Gregory J | $71,887 | |
| Previous Owner | Terwillegar Gary L | $25,500 |
Source: Public Records
Tax History Compared to Growth
Tax History
| Year | Tax Paid | Tax Assessment Tax Assessment Total Assessment is a certain percentage of the fair market value that is determined by local assessors to be the total taxable value of land and additions on the property. | Land | Improvement |
|---|---|---|---|---|
| 2026 | $5,476 | $628,970 | $117,470 | $511,500 |
| 2025 | $5,476 | $628,970 | $117,470 | $511,500 |
| 2024 | $5,310 | $628,970 | $117,470 | $511,500 |
| 2023 | $5,276 | $628,970 | $117,470 | $511,500 |
| 2022 | $5,110 | $510,250 | $93,630 | $416,620 |
| 2021 | $4,893 | $462,030 | $85,120 | $376,910 |
| 2020 | $4,987 | $457,870 | $80,720 | $377,150 |
| 2019 | $4,233 | $426,480 | $74,600 | $351,880 |
| 2018 | $4,530 | $349,300 | $64,210 | $285,090 |
| 2017 | $3,823 | $349,300 | $64,210 | $285,090 |
| 2016 | $3,754 | $313,750 | $61,150 | $252,600 |
| 2015 | $3,642 | $308,340 | $61,150 | $247,190 |
| 2014 | -- | $289,540 | $58,110 | $231,430 |
| 2013 | -- | $289,540 | $58,110 | $231,430 |
Source: Public Records
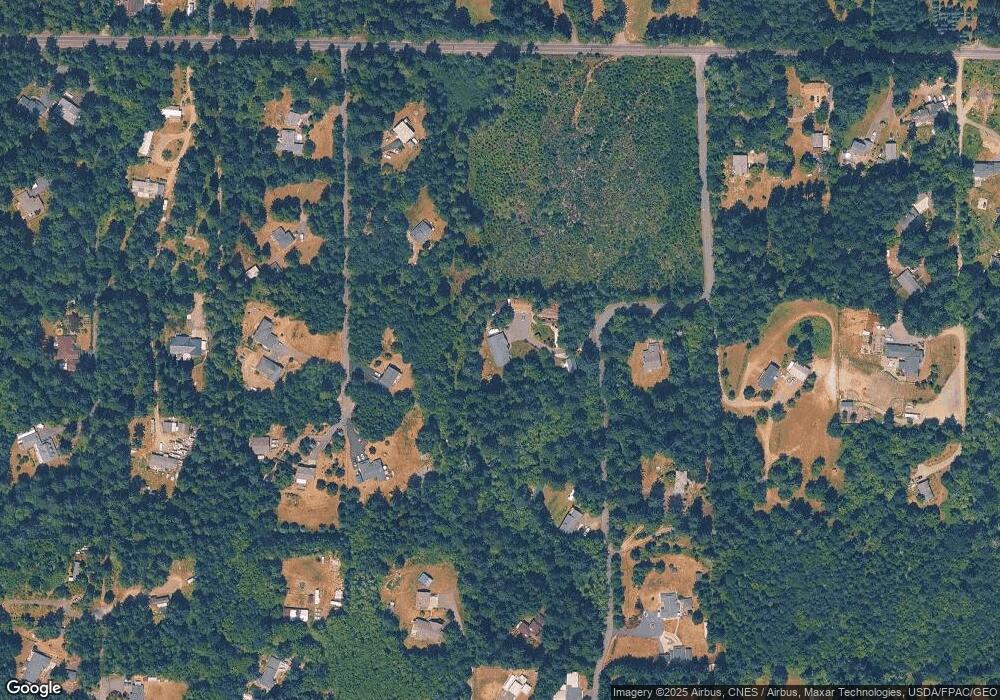
Map
Nearby Homes
- 10569 Glenwood Rd SW
- 0 Silver Ln SW
- 11618 Sidney Rd SW
- 12524 Westbrook Dr SW
- 11291 Cooper Ave SW
- 10223 Glenwood Rd SW
- 10574 Sidney Rd SW
- 11676 Fry Ave SW
- 453 SW View Dr
- 514 SW Hipkins Ct
- 10088 Fairview Blvd SW
- 11255 Ridge Rim Trail SE
- 9504 SW Caulfield Ln
- 8840 Conwhit Ln SW
- 0 Lake Helena Trail Unit NWM2446806
- 10966 Branch Place SE
- 8718 Sidney Rd SW
- 959 SE Spencer Ave
- 10668 Bethel Burley Rd SE
- 5040 SW Lake Helena Rd
- 1924 SW Wildwood Rd
- 0 LB Abbey Ln SW
- 1906 SW Wildwood Rd
- 11455 Abbey Ln SW
- 1942 SW Wildwood Rd
- 11470 Abbey Ln SW
- 11475 Abbey Ln SW
- 1978 SW Wildwood Rd
- 1996 SW Wildwood Rd
- 1888 SW Wildwood Rd
- 1960 SW Wildwood Rd
- 11425 Abbey Ln SW
- 11538 Abbey Ln SW
- 2014 SW Wildwood Rd
- 1590 SW Wildwood Rd
- 11495 Abbey Ln SW
- 2034 SW Wildwood Rd
- 1625 SW Wildwood Rd
- 1611 SW Wildwood Rd