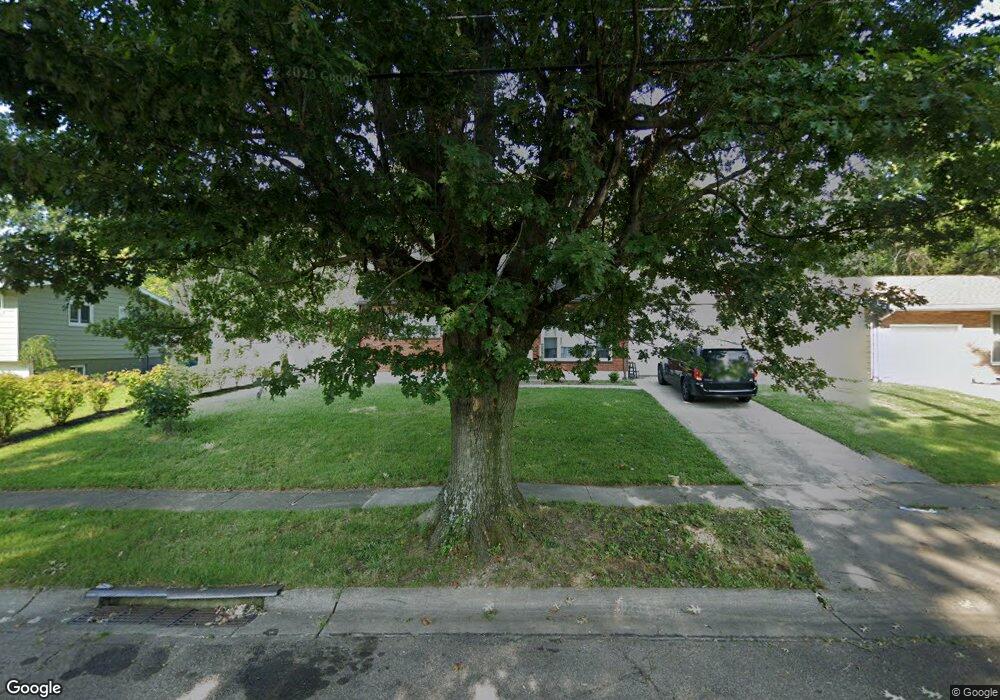
11459 Framingham Dr Cincinnati, OH 45240
Estimated Value: $255,428 - $298,000
4
Beds
2
Baths
2,196
Sq Ft
$127/Sq Ft
Est. Value
About This Home
This home is located at 11459 Framingham Dr, Cincinnati, OH 45240 and is currently estimated at $278,357, approximately $126 per square foot. 11459 Framingham Dr is a home located in Hamilton County with nearby schools including Calvary Academy- The and St Gabriel Consolidated School.
Ownership History
Date
Name
Owned For
Owner Type
Purchase Details
Closed on
Nov 28, 2005
Sold by
Citifinancial Mortgage Co Inc
Bought by
Your Next Home Llc
Current Estimated Value
Purchase Details
Closed on
Dec 2, 2004
Sold by
Turner Ronald
Bought by
Citifinancial Mortgage Co Inc
Purchase Details
Closed on
Aug 11, 1999
Sold by
Renick David M Tr
Bought by
Turner Ronald
Home Financials for this Owner
Home Financials are based on the most recent Mortgage that was taken out on this home.
Original Mortgage
$88,000
Interest Rate
8.7%
Mortgage Type
Stand Alone First
Purchase Details
Closed on
Apr 16, 1997
Sold by
Abaecherli David
Bought by
Parsley Jean A
Create a Home Valuation Report for This Property
The Home Valuation Report is an in-depth analysis detailing your home's value as well as a comparison with similar homes in the area
Home Values in the Area
Average Home Value in this Area
Purchase History
| Date | Buyer | Sale Price | Title Company |
|---|---|---|---|
| Your Next Home Llc | $76,000 | None Available | |
| Citifinancial Mortgage Co Inc | $89,900 | None Available | |
| Turner Ronald | $110,000 | -- | |
| Parsley Jean A | $52,400 | -- |
Source: Public Records
Mortgage History
| Date | Status | Borrower | Loan Amount |
|---|---|---|---|
| Previous Owner | Turner Ronald | $88,000 |
Source: Public Records
Tax History
| Year | Tax Paid | Tax Assessment Tax Assessment Total Assessment is a certain percentage of the fair market value that is determined by local assessors to be the total taxable value of land and additions on the property. | Land | Improvement |
|---|---|---|---|---|
| 2025 | $4,311 | $71,250 | $10,185 | $61,065 |
| 2023 | $4,290 | $71,250 | $10,185 | $61,065 |
| 2022 | $3,374 | $42,519 | $7,830 | $34,689 |
| 2021 | $3,363 | $42,519 | $7,830 | $34,689 |
| 2020 | $3,321 | $42,519 | $7,830 | $34,689 |
| 2019 | $3,167 | $35,431 | $6,524 | $28,907 |
| 2018 | $3,172 | $35,431 | $6,524 | $28,907 |
| 2017 | $3,092 | $35,431 | $6,524 | $28,907 |
| 2016 | $3,197 | $35,515 | $7,329 | $28,186 |
| 2015 | $2,937 | $35,515 | $7,329 | $28,186 |
| 2014 | $2,716 | $35,515 | $7,329 | $28,186 |
| 2013 | $2,921 | $39,026 | $8,054 | $30,972 |
Source: Public Records
Map
Nearby Homes
- 11481 Fremantle Dr
- 11431 Fremantle Dr
- 784 Farnham Ct
- 604 Smiley Ave
- 11131 Hanover Rd
- 694 Park Ave
- 564 Cloverdale Ave
- 778 Danbury Rd
- 683 Danbury Rd
- 22 Oakwood Ct
- 18 Oakwood Ct
- 11570 Rose Ln
- 805 Halesworth Dr
- 10 Woodside Ct
- 749 Converse Dr
- 12020 Elkridge Dr
- 12069 Cantrell Dr
- 12091 Hitchcock Dr
- 440 W Sharon Rd
- 287 Bedford Glen Ln Unit 27
- 11469 Framingham Dr
- 11449 Framingham Dr
- 11474 Fremantle Dr
- 11464 Fremantle Dr
- 11480 Fremantle Dr
- 11477 Framingham Dr
- 11439 Framingham Dr
- 11454 Fremantle Dr
- 11458 Framingham Dr
- 11468 Framingham Dr
- 11488 Fremantle Dr
- 11448 Framingham Dr
- 11487 Framingham Dr
- 11476 Framingham Dr
- 11446 Fremantle Dr
- 11429 Framingham Dr
- 11498 Fremantle Dr
- 11438 Framingham Dr
- 11486 Framingham Dr
- 11436 Fremantle Dr
Your Personal Tour Guide
Ask me questions while you tour the home.