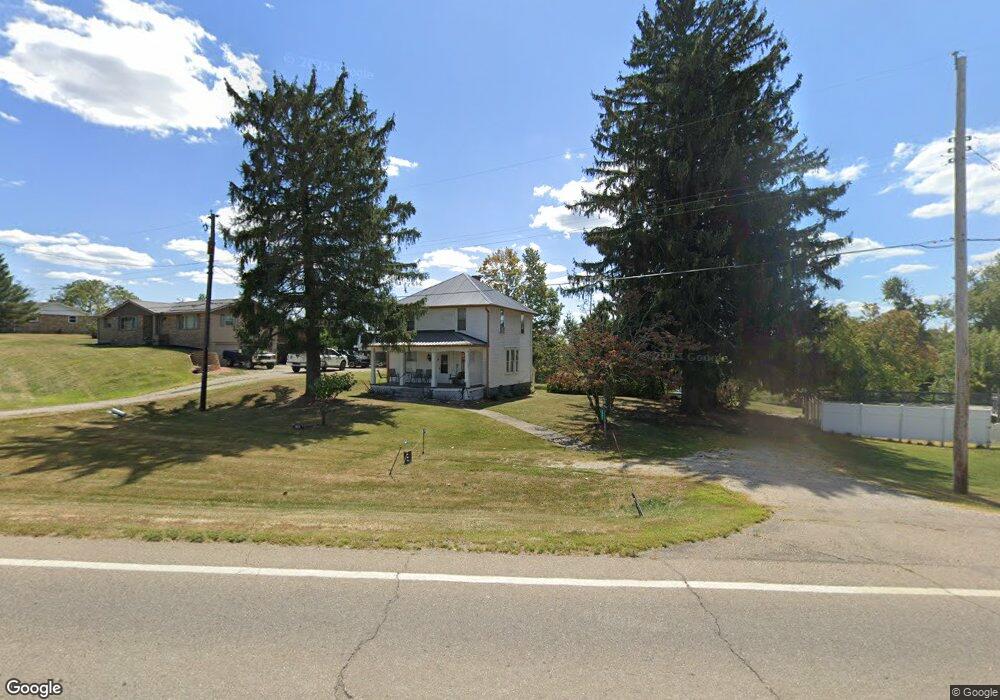
1146 E Main St Barnesville, OH 43713
Estimated Value: $146,000 - $236,000
3
Beds
2
Baths
1,568
Sq Ft
$119/Sq Ft
Est. Value
About This Home
This home is located at 1146 E Main St, Barnesville, OH 43713 and is currently estimated at $185,823, approximately $118 per square foot. 1146 E Main St is a home located in Belmont County with nearby schools including Barnesville Elementary School, Barnesville Middle School, and Barnesville High School.
Ownership History
Date
Name
Owned For
Owner Type
Purchase Details
Closed on
Mar 27, 2025
Sold by
Ackerman Evelyn L
Bought by
Ackerman Samuel Keith
Current Estimated Value
Purchase Details
Closed on
Sep 24, 2008
Sold by
Ackerman Dawn Renee
Bought by
Ackerman Harvey Keith
Purchase Details
Closed on
Aug 6, 2008
Sold by
Hart Lois
Bought by
Ackerman Samuel Keith
Purchase Details
Closed on
Jun 30, 2008
Sold by
Ackerman Samuel Keith
Bought by
Ackerman Dawn Renee
Purchase Details
Closed on
Feb 26, 2008
Sold by
Ackerman Dawn Renee
Bought by
Ackerman Samuel Keith
Purchase Details
Closed on
Nov 28, 2001
Bought by
Brownfield Joyce Etal 3
Purchase Details
Closed on
Apr 27, 1999
Bought by
Brownfield Joyce Etal 3
Purchase Details
Closed on
Jan 1, 1986
Sold by
Rowley Myrtle E
Bought by
Rowley Myrtle E
Create a Home Valuation Report for This Property
The Home Valuation Report is an in-depth analysis detailing your home's value as well as a comparison with similar homes in the area
Home Values in the Area
Average Home Value in this Area
Purchase History
| Date | Buyer | Sale Price | Title Company |
|---|---|---|---|
| Ackerman Samuel Keith | -- | None Listed On Document | |
| Ackerman Harvey Keith | -- | None Available | |
| Ackerman Samuel Keith | $16,000 | None Available | |
| Ackerman Samuel Keith | $16,000 | Attorney | |
| Ackerman Samuel Keith | $16,000 | None Available | |
| Ackerman Dawn Renee | -- | None Available | |
| Ackerman Samuel Keith | -- | None Available | |
| Brownfield Joyce Etal 3 | -- | -- | |
| Brownfield Joyce Etal 3 | -- | -- | |
| Rowley Myrtle E | -- | -- |
Source: Public Records
Tax History
| Year | Tax Paid | Tax Assessment Tax Assessment Total Assessment is a certain percentage of the fair market value that is determined by local assessors to be the total taxable value of land and additions on the property. | Land | Improvement |
|---|---|---|---|---|
| 2025 | $1,133 | $34,500 | $8,580 | $25,920 |
| 2024 | $1,116 | $34,500 | $8,580 | $25,920 |
| 2023 | $976 | $28,900 | $7,730 | $21,170 |
| 2022 | $975 | $28,899 | $7,731 | $21,168 |
| 2021 | $977 | $28,899 | $7,731 | $21,168 |
| 2020 | $851 | $24,080 | $6,440 | $17,640 |
| 2019 | $854 | $24,080 | $6,440 | $17,640 |
| 2018 | $782 | $24,080 | $6,440 | $17,640 |
| 2017 | $715 | $19,750 | $7,700 | $12,050 |
| 2016 | $672 | $19,750 | $7,700 | $12,050 |
| 2015 | $670 | $19,750 | $7,700 | $12,050 |
| 2014 | $645 | $18,810 | $7,000 | $11,810 |
| 2013 | $644 | $18,810 | $7,000 | $11,810 |
Source: Public Records
Map
Nearby Homes
- 0 Fairmont Ave Unit 5163774
- 0 Fairmont Ave Unit 5163784
- 118 Pine Ln
- 105 Bethesda St
- 164 Pine Ln
- 613 E Main St
- 62239 Hillcrest Rd
- 136 E Walnut St
- 152 E Main St
- 202 Walton Ave
- 617 Park St
- 618 Park St
- 329 S Chestnut St
- TBD W Main St
- 0 County Road 114
- 61900 Fairview Rd
- Lot 1 Cattle Dr
- 101 Willow St
- 430 S Main St
- 57128 Somerton Hwy
- 1164 E Main St
- 1132 E Main St
- 36340 Bethesda Street Extension
- 1094 E Main St
- 61710 Roosevelt Rd
- 207 Roosevelt Rd
- 269 Roosevelt Rd
- 36202 Bethesda Street Extension
- 36187 Bethesda Street Extension
- 971 Shamrock Dr
- 61620 Roosevelt Rd
- 36161 Bethesda Street Extension
- 61760 W Tacoma Rd
- 36141 Bethesda Street Extension
- 61582 Roosevelt Rd
- 61599 Roosevelt Rd
- 36124 Bethesda Street Extension
- 36221 Bethesda Street Extension
- 61761 Roosevelt Rd
- 61579 Roosevelt Rd
Your Personal Tour Guide
Ask me questions while you tour the home.