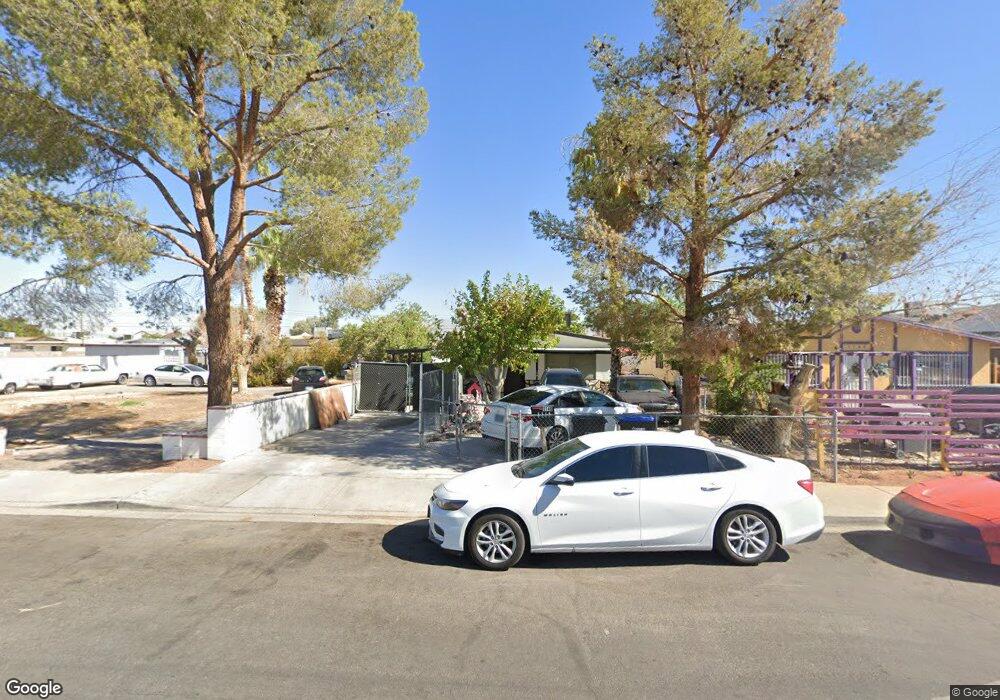
1146 Hart Ave Las Vegas, NV 89106
West Las Vegas NeighborhoodEstimated Value: $236,000 - $299,000
3
Beds
1
Bath
960
Sq Ft
$279/Sq Ft
Est. Value
About This Home
This home is located at 1146 Hart Ave, Las Vegas, NV 89106 and is currently estimated at $268,046, approximately $279 per square foot. 1146 Hart Ave is a home located in Clark County with nearby schools including H.P. Fitzgerald Elementary School, West Prepatory Academy At Charlles I West Hall Sec, and Canyon Springs High School And The Leadership And.
Ownership History
Date
Name
Owned For
Owner Type
Purchase Details
Closed on
Oct 19, 2006
Sold by
Jefferson Thomas Charles and Jefferson Seona A
Bought by
Jefferson Thomas Charles and Jefferson Seona A
Current Estimated Value
Purchase Details
Closed on
Aug 31, 2004
Sold by
Jefferson Thomas Charles
Bought by
Jefferson Thomas Charles and Jefferson Seona A
Home Financials for this Owner
Home Financials are based on the most recent Mortgage that was taken out on this home.
Original Mortgage
$75,200
Interest Rate
5.92%
Mortgage Type
New Conventional
Purchase Details
Closed on
Jul 27, 2001
Sold by
Lee John Willie
Bought by
Jefferson Thomas Charles
Home Financials for this Owner
Home Financials are based on the most recent Mortgage that was taken out on this home.
Original Mortgage
$72,856
Interest Rate
7.21%
Mortgage Type
FHA
Create a Home Valuation Report for This Property
The Home Valuation Report is an in-depth analysis detailing your home's value as well as a comparison with similar homes in the area
Home Values in the Area
Average Home Value in this Area
Purchase History
| Date | Buyer | Sale Price | Title Company |
|---|---|---|---|
| Jefferson Thomas Charles | -- | None Available | |
| Jefferson Thomas Charles | -- | Equity Title Of Nevada | |
| Jefferson Thomas Charles | $74,000 | Old Republic Title Company |
Source: Public Records
Mortgage History
| Date | Status | Borrower | Loan Amount |
|---|---|---|---|
| Closed | Jefferson Thomas Charles | $75,200 | |
| Closed | Jefferson Thomas Charles | $72,856 |
Source: Public Records
Tax History Compared to Growth
Tax History
| Year | Tax Paid | Tax Assessment Tax Assessment Total Assessment is a certain percentage of the fair market value that is determined by local assessors to be the total taxable value of land and additions on the property. | Land | Improvement |
|---|---|---|---|---|
| 2025 | $259 | $21,993 | $10,500 | $11,493 |
| 2024 | $252 | $21,993 | $10,500 | $11,493 |
| 2023 | $205 | $20,881 | $10,500 | $10,381 |
| 2022 | $256 | $19,668 | $10,404 | $9,264 |
| 2021 | $248 | $15,805 | $7,175 | $8,630 |
| 2020 | $236 | $15,569 | $7,175 | $8,394 |
| 2019 | $225 | $14,204 | $6,125 | $8,079 |
| 2018 | $215 | $13,516 | $5,950 | $7,566 |
| 2017 | $418 | $12,745 | $5,250 | $7,495 |
| 2016 | $205 | $11,549 | $4,200 | $7,349 |
| 2015 | $203 | $9,755 | $2,625 | $7,130 |
| 2014 | $197 | $8,120 | $2,625 | $5,495 |
Source: Public Records
Map
Nearby Homes
- 1249 Hassell Ave
- 1030 W Lake Mead Blvd
- 1316 Lawry Ave
- 1212 Balzar Ave
- 1328 Balzar Ave
- 952 Balzar Ave
- 832 Hart Ave
- 2222 N Martin l King Blvd
- 1212 Eleanor Ave
- 844 Balzar Ave
- 1972 H St
- 2100 Fred Brown Dr
- 2130 Revere St
- 729 van Ert Ave
- 1631 Dwayne Stedman Ave
- 616 Bowman Ave
- 700 van Ert Ave
- 1648 J St
- 2109 Jesse Scott St
- 2405 Copperbelt St