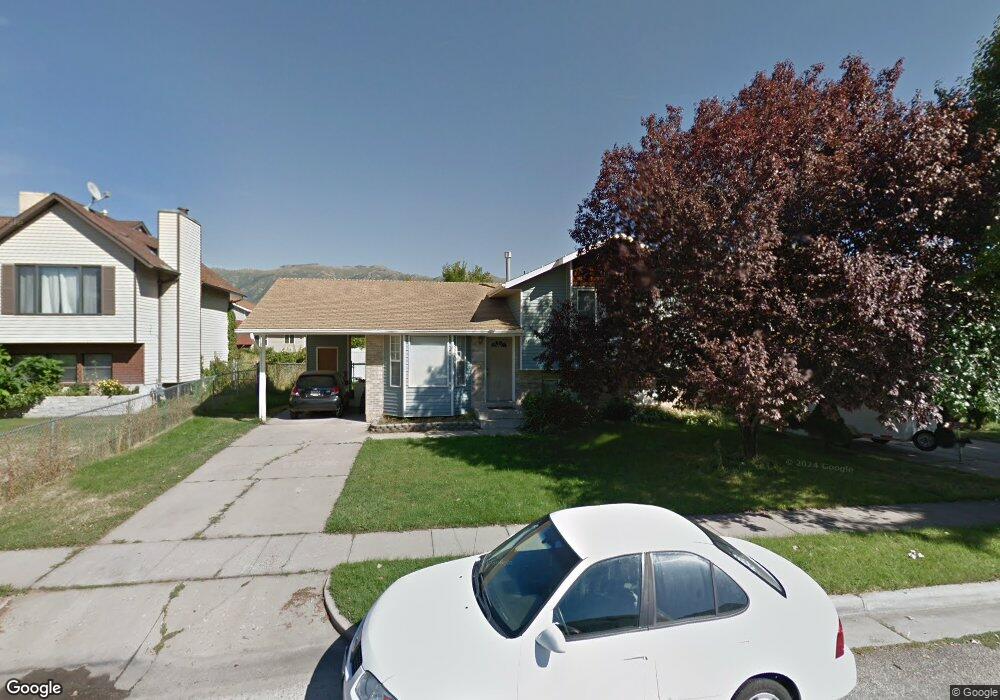
1146 N 200 W Layton, UT 84041
Estimated Value: $412,548 - $461,000
4
Beds
2
Baths
1,562
Sq Ft
$276/Sq Ft
Est. Value
About This Home
This home is located at 1146 N 200 W, Layton, UT 84041 and is currently estimated at $430,637, approximately $275 per square foot. 1146 N 200 W is a home located in Davis County with nearby schools including Crestview Elementary School, Central Davis Junior High School, and Northridge High School.
Ownership History
Date
Name
Owned For
Owner Type
Purchase Details
Closed on
Apr 21, 2023
Sold by
Hardy Betty S
Bought by
Betty Hardy Living Trust
Current Estimated Value
Purchase Details
Closed on
Dec 7, 2000
Sold by
Hammon Michael E and Hammon Mary E
Bought by
Hardy Betty S
Home Financials for this Owner
Home Financials are based on the most recent Mortgage that was taken out on this home.
Original Mortgage
$91,600
Interest Rate
7.66%
Create a Home Valuation Report for This Property
The Home Valuation Report is an in-depth analysis detailing your home's value as well as a comparison with similar homes in the area
Home Values in the Area
Average Home Value in this Area
Purchase History
| Date | Buyer | Sale Price | Title Company |
|---|---|---|---|
| Betty Hardy Living Trust | -- | Integrated Title | |
| Hardy Betty S | -- | Bonneville Title Company |
Source: Public Records
Mortgage History
| Date | Status | Borrower | Loan Amount |
|---|---|---|---|
| Previous Owner | Hardy Betty S | $91,600 |
Source: Public Records
Tax History Compared to Growth
Tax History
| Year | Tax Paid | Tax Assessment Tax Assessment Total Assessment is a certain percentage of the fair market value that is determined by local assessors to be the total taxable value of land and additions on the property. | Land | Improvement |
|---|---|---|---|---|
| 2025 | $1,541 | $200,200 | $87,361 | $112,839 |
| 2024 | $550 | $193,599 | $102,610 | $90,989 |
| 2023 | $1,835 | $188,100 | $71,409 | $116,690 |
| 2022 | $1,869 | $344,000 | $120,499 | $223,501 |
| 2021 | $0 | $257,000 | $86,997 | $170,003 |
| 2020 | $1,533 | $222,000 | $75,671 | $146,329 |
| 2019 | $1,516 | $215,000 | $74,193 | $140,807 |
| 2018 | $1,355 | $193,000 | $74,193 | $118,807 |
| 2016 | $59 | $92,455 | $22,084 | $70,371 |
| 2015 | $1,202 | $83,820 | $22,084 | $61,736 |
| 2014 | $1,147 | $81,775 | $22,084 | $59,691 |
| 2013 | -- | $86,274 | $19,034 | $67,240 |
Source: Public Records
Map
Nearby Homes
- 103 W 1275 N
- 1096 N 300 W
- 1180 N 100 E
- 1490 N 175 W
- 1583 N 25 E
- 324 E 1325 N
- 1474 N 285 E
- 1553 N 250 E
- 398 Paul Ave
- 1837 N 440 W
- 495 Spurlock St
- 937 Rainbow Dr
- 480 Spurlock St
- 1366 N Main St Unit 5
- 1908 N 200 W
- 441 Church St
- 785 Sherwood Dr
- 526 King St Unit 2
- 2044 Evans Cove Loop
- 2048 Evans Cove Loop