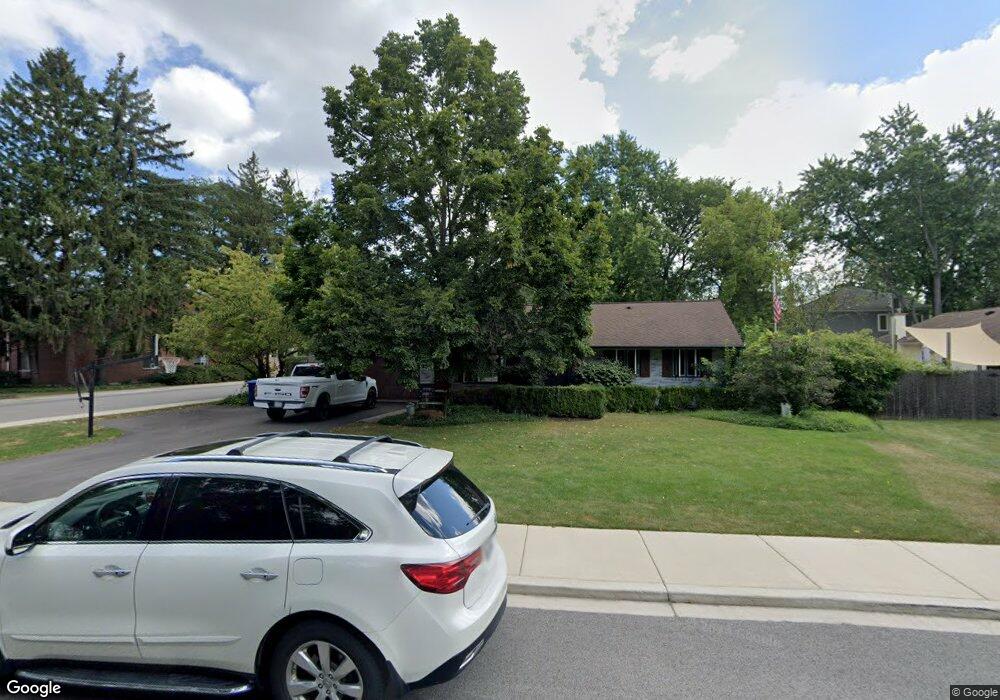
1146 Osterman Ave Deerfield, IL 60015
Estimated Value: $527,388 - $648,000
4
Beds
2
Baths
1,700
Sq Ft
$358/Sq Ft
Est. Value
About This Home
This home is located at 1146 Osterman Ave, Deerfield, IL 60015 and is currently estimated at $607,847, approximately $357 per square foot. 1146 Osterman Ave is a home located in Lake County with nearby schools including Kipling Elementary School, Alan B Shepard Middle School, and Deerfield High School.
Ownership History
Date
Name
Owned For
Owner Type
Purchase Details
Closed on
Mar 1, 2023
Sold by
Hoppe Gregory J and Hoppe Rebecca Ann
Bought by
Hoppe Gregory J and Hoppe Rebecca Ann
Current Estimated Value
Purchase Details
Closed on
Aug 23, 2017
Sold by
Kaulentis Chrysanthe T
Bought by
Hoppe Gregory J
Home Financials for this Owner
Home Financials are based on the most recent Mortgage that was taken out on this home.
Original Mortgage
$275,000
Interest Rate
3.75%
Mortgage Type
New Conventional
Purchase Details
Closed on
May 4, 2017
Sold by
Kerstein William
Bought by
Kaulentis Chrysanthe T
Purchase Details
Closed on
May 1, 2007
Sold by
Kerstein Chrysanthe T and Kaulentis Chrysanthe T
Bought by
Irre Kerstein William and Chrysanthe Kaulentis 2007 Irrevocable Tr
Create a Home Valuation Report for This Property
The Home Valuation Report is an in-depth analysis detailing your home's value as well as a comparison with similar homes in the area
Home Values in the Area
Average Home Value in this Area
Purchase History
| Date | Buyer | Sale Price | Title Company |
|---|---|---|---|
| Hoppe Gregory J | -- | None Listed On Document | |
| Hoppe Gregory J | $415,000 | Attorney | |
| Kaulentis Chrysanthe T | -- | None Available | |
| Irre Kerstein William | -- | None Available |
Source: Public Records
Mortgage History
| Date | Status | Borrower | Loan Amount |
|---|---|---|---|
| Previous Owner | Hoppe Gregory J | $275,000 |
Source: Public Records
Tax History
| Year | Tax Paid | Tax Assessment Tax Assessment Total Assessment is a certain percentage of the fair market value that is determined by local assessors to be the total taxable value of land and additions on the property. | Land | Improvement |
|---|---|---|---|---|
| 2024 | $10,913 | $129,107 | $56,260 | $72,847 |
| 2023 | $12,200 | $123,903 | $53,992 | $69,911 |
| 2022 | $12,200 | $134,724 | $57,992 | $76,732 |
| 2021 | $11,504 | $129,892 | $55,912 | $73,980 |
| 2020 | $11,065 | $130,166 | $56,030 | $74,136 |
| 2019 | $10,813 | $129,945 | $55,935 | $74,010 |
| 2018 | $10,120 | $129,353 | $59,287 | $70,066 |
| 2017 | $9,829 | $128,941 | $59,098 | $69,843 |
| 2016 | $9,957 | $124,065 | $56,863 | $67,202 |
| 2015 | $9,740 | $116,570 | $53,428 | $63,142 |
| 2014 | $7,867 | $94,057 | $53,810 | $40,247 |
| 2012 | $7,684 | $93,227 | $53,335 | $39,892 |
Source: Public Records
Map
Nearby Homes
- 525 Mallard Ln
- 954 Osterman Ave
- 950 Brookside Ln
- 834 Chestnut St
- 826 Chestnut St
- 926 Cedar St
- 938 Hemlock St
- 1302 Hazel Ave
- 333 Birchwood Ave
- 1030 Chestnut St
- 429 Elm St Unit 5J
- 421 Elm St Unit 6K
- 1004 Broadmoor Place
- 501 Kelburn Rd
- 1625 Marcie Ct Unit 5
- 1054 Broadmoor Place
- 1106 Waukegan Rd
- 730 Castlewood Ln
- 1632 Village Green Ct
- 1555 Samanthas Way
- 1138 Osterman Ave
- 1130 Osterman Ave
- 1122 Osterman Ave
- 1154 Osterman Ave Unit B
- 1152 Osterman Ave Unit A
- 1152 Osterman Ave Unit B
- 1156 Osterman Ave Unit A
- 1156 Osterman Ave Unit B
- 1156 Osterman Ave Unit C
- 1156 Osterman Ave Unit C
- 1152 Osterman Ave Unit D
- 1152 Osterman Ave Unit C
- 1154 Osterman Ave Unit D
- 1154 Osterman Ave Unit C
- 1156 Osterman Ave Unit D
- 1154 Osterman Ave Unit B
- 1152 Osterman Ave Unit A
- 1152 Osterman Ave Unit B
- 1156 Osterman Ave Unit A
- 1156 Osterman Ave Unit B
Your Personal Tour Guide
Ask me questions while you tour the home.