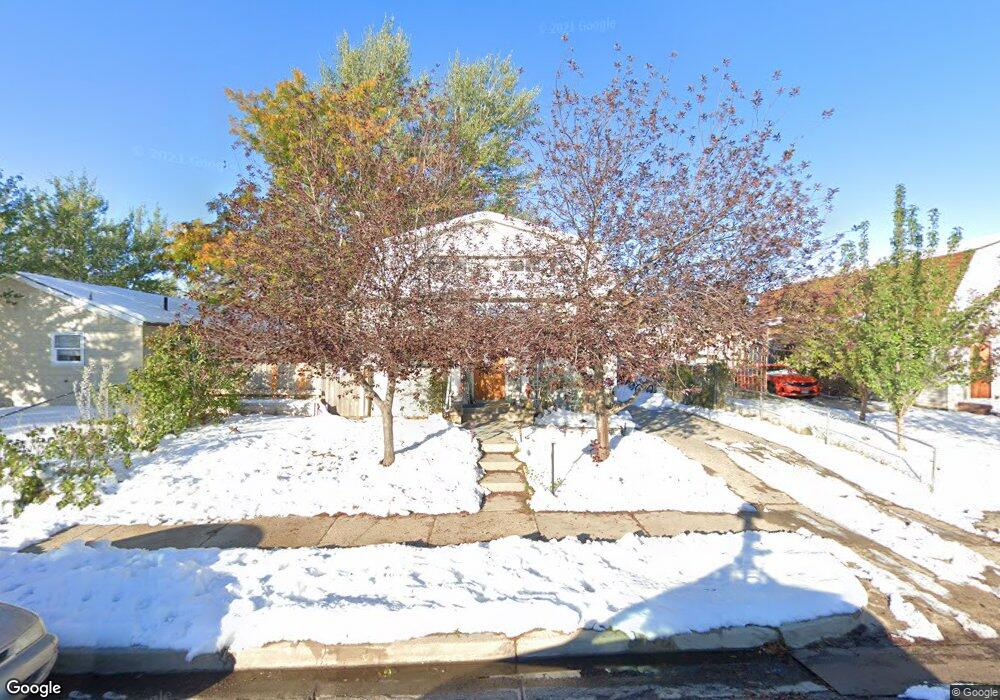
1146 S Cherry St Casper, WY 82604
West Casper NeighborhoodEstimated Value: $274,000 - $293,000
4
Beds
2
Baths
2,496
Sq Ft
$115/Sq Ft
Est. Value
About This Home
This home is located at 1146 S Cherry St, Casper, WY 82604 and is currently estimated at $286,467, approximately $114 per square foot. 1146 S Cherry St is a home located in Natrona County with nearby schools including St. Anthony Tri-Parish Catholic School and Mount Hope Lutheran School.
Ownership History
Date
Name
Owned For
Owner Type
Purchase Details
Closed on
Aug 5, 2022
Sold by
Byer and Adam
Bought by
Johnson Zeth and Quezada Lisa
Current Estimated Value
Home Financials for this Owner
Home Financials are based on the most recent Mortgage that was taken out on this home.
Original Mortgage
$250,381
Outstanding Balance
$239,734
Interest Rate
5.7%
Mortgage Type
FHA
Estimated Equity
$46,733
Purchase Details
Closed on
May 1, 2020
Sold by
Secretary Of Housing & Urban Development
Bought by
Rael Phillip
Purchase Details
Closed on
Jan 12, 2020
Sold by
Rael Phillip
Bought by
Byer Jamie
Home Financials for this Owner
Home Financials are based on the most recent Mortgage that was taken out on this home.
Original Mortgage
$165,938
Interest Rate
2.7%
Mortgage Type
FHA
Purchase Details
Closed on
Oct 25, 2019
Sold by
Lakeview Loan Servicing Llc
Bought by
Hud
Purchase Details
Closed on
Oct 11, 2018
Sold by
Reed Marvin G and Reed Nancy J
Bought by
Lakeview Loan Servicing Llc
Create a Home Valuation Report for This Property
The Home Valuation Report is an in-depth analysis detailing your home's value as well as a comparison with similar homes in the area
Home Values in the Area
Average Home Value in this Area
Purchase History
| Date | Buyer | Sale Price | Title Company |
|---|---|---|---|
| Johnson Zeth | -- | American Title Company | |
| Rael Phillip | -- | American Title Agency | |
| Byer Jamie | -- | American Title Agency | |
| Hud | -- | None Available | |
| Lakeview Loan Servicing Llc | $132,020 | None Available |
Source: Public Records
Mortgage History
| Date | Status | Borrower | Loan Amount |
|---|---|---|---|
| Open | Johnson Zeth | $250,381 | |
| Previous Owner | Byer Jamie | $5,425 | |
| Previous Owner | Byer Jamie | $165,938 | |
| Closed | Johnson Zeth | $8,980 |
Source: Public Records
Tax History
| Year | Tax Paid | Tax Assessment Tax Assessment Total Assessment is a certain percentage of the fair market value that is determined by local assessors to be the total taxable value of land and additions on the property. | Land | Improvement |
|---|---|---|---|---|
| 2025 | $1,291 | $17,982 | $2,542 | $15,440 |
| 2024 | $1,678 | $23,365 | $3,347 | $20,018 |
| 2023 | $1,696 | $23,272 | $3,619 | $19,653 |
| 2022 | $1,666 | $22,850 | $2,859 | $19,991 |
| 2021 | $1,471 | $20,178 | $2,902 | $17,276 |
| 2020 | $1,348 | $18,500 | $6,793 | $11,707 |
| 2019 | $1,401 | $19,220 | $2,093 | $17,127 |
| 2018 | $1,268 | $17,400 | $3,026 | $14,374 |
| 2017 | $1,262 | $17,318 | $2,470 | $14,848 |
| 2015 | $1,188 | $16,301 | $2,470 | $13,831 |
| 2014 | $1,162 | $15,939 | $2,470 | $13,469 |
Source: Public Records
Map
Nearby Homes
- 1237 S Boxelder St
- 1434 S Boxelder St
- 1329 S Poplar St
- 1315 Birch St
- 1017 & 1021 S Cedar St
- 833 W 13th St
- 737 W 12th St
- 606 W 11th St
- 920 W Midwest Ave
- 935 W Yellowstone
- 428 W 12th St
- 1242 S Elm St
- 1645 Sycamore St
- 1537 Kit Carson Ave
- 835 S Ash St
- 711 W 20th St
- 1204 W 23rd St
- 2024 Cy Ave
- 1545 S David St
- 1227 S Center St
- 1146 S Cherry St Unit 12th Street
- 1140 S Cherry St
- 1304 W 12th St
- 1145 S Cottonwood St
- 1137 S Cottonwood St
- 1155 S Cottonwood St
- 1155 S Cottonwood St Unit 12th
- 1127 S Cottonwood St
- 1149 S Cherry St
- 1226 W 12th St
- 1137 S Cherry St
- 1114 S Cherry St
- 1341 W 12th St
- 1121 S Cottonwood St
- 1129 S Cherry St
- 1237 W 12th St
- 1237 W 12th St Unit Cherry
- 1121 S Cherry St
- 1212 S Cherry St
- 1212 S Cherry St Unit 13th