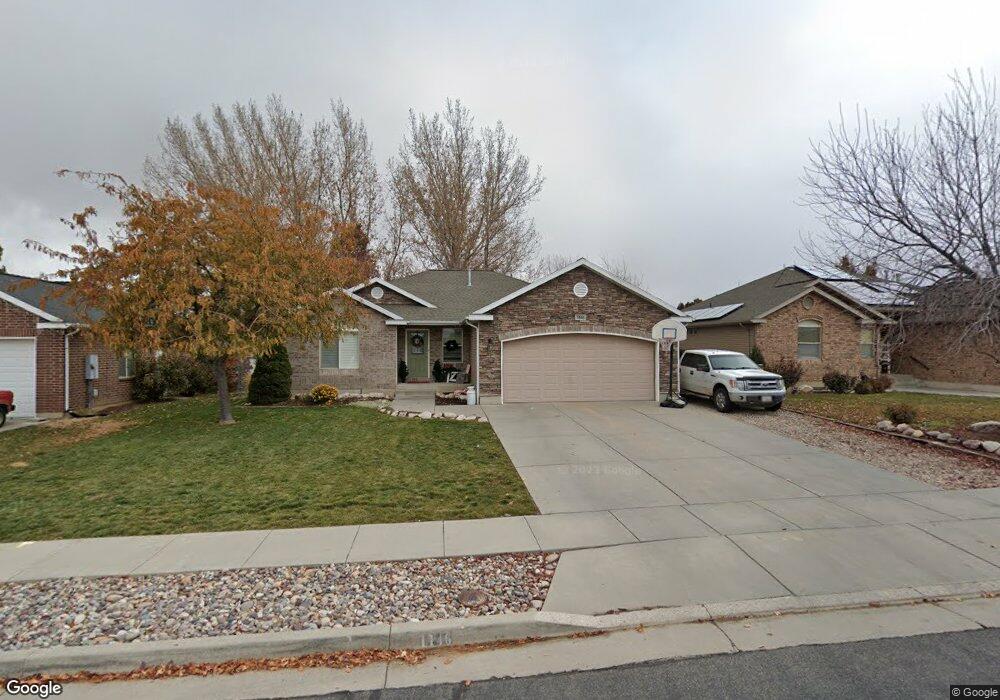
1146 W 1460 N Clearfield, UT 84015
Estimated Value: $515,000 - $539,000
5
Beds
3
Baths
2,950
Sq Ft
$179/Sq Ft
Est. Value
About This Home
This home is located at 1146 W 1460 N, Clearfield, UT 84015 and is currently estimated at $528,944, approximately $179 per square foot. 1146 W 1460 N is a home located in Davis County with nearby schools including Clinton Elementary School, Sunset Junior High School, and Clearfield High School.
Ownership History
Date
Name
Owned For
Owner Type
Purchase Details
Closed on
Jun 10, 2016
Sold by
Tervolet Becky Brown
Bought by
Howell Kellen T and Howell Holli
Current Estimated Value
Purchase Details
Closed on
Feb 13, 2014
Sold by
Cummings Curtis A and Cummings Jennifer N
Bought by
Brown Paul W and Paul W And Joyce M Brown Family Trust
Purchase Details
Closed on
Aug 13, 2004
Sold by
Ken Mitchell Development Co Inc
Bought by
Cummings Curtis A and Cummings Jennifer N
Home Financials for this Owner
Home Financials are based on the most recent Mortgage that was taken out on this home.
Original Mortgage
$144,800
Interest Rate
6.17%
Mortgage Type
Purchase Money Mortgage
Create a Home Valuation Report for This Property
The Home Valuation Report is an in-depth analysis detailing your home's value as well as a comparison with similar homes in the area
Home Values in the Area
Average Home Value in this Area
Purchase History
| Date | Buyer | Sale Price | Title Company |
|---|---|---|---|
| Howell Kellen T | -- | Us Title Company Of Utah | |
| Brown Paul W | -- | None Available | |
| Cummings Curtis A | -- | Founders Title Co | |
| Ken Mitchell Development Co Inc | -- | Founders Title Co |
Source: Public Records
Mortgage History
| Date | Status | Borrower | Loan Amount |
|---|---|---|---|
| Previous Owner | Cummings Curtis A | $144,800 | |
| Closed | Cummings Curtis A | $27,200 |
Source: Public Records
Tax History
| Year | Tax Paid | Tax Assessment Tax Assessment Total Assessment is a certain percentage of the fair market value that is determined by local assessors to be the total taxable value of land and additions on the property. | Land | Improvement |
|---|---|---|---|---|
| 2025 | $2,786 | $267,850 | $89,123 | $178,727 |
| 2024 | $2,817 | $272,250 | $98,091 | $174,159 |
| 2023 | $2,678 | $479,000 | $111,382 | $367,618 |
| 2022 | $2,846 | $281,600 | $68,405 | $213,195 |
| 2021 | $2,569 | $377,000 | $85,174 | $291,826 |
| 2020 | $2,244 | $326,000 | $72,129 | $253,871 |
| 2019 | $2,192 | $311,000 | $84,742 | $226,258 |
| 2018 | $2,066 | $288,000 | $71,635 | $216,365 |
| 2016 | $1,854 | $133,485 | $27,844 | $105,641 |
| 2015 | $1,822 | $124,740 | $27,844 | $96,896 |
| 2014 | $1,970 | $136,950 | $27,844 | $109,106 |
| 2013 | -- | $105,839 | $27,143 | $78,696 |
Source: Public Records
Map
Nearby Homes
Your Personal Tour Guide
Ask me questions while you tour the home.