Estimated Value: $573,000 - $644,000
4
Beds
3
Baths
2,494
Sq Ft
$241/Sq Ft
Est. Value
About This Home
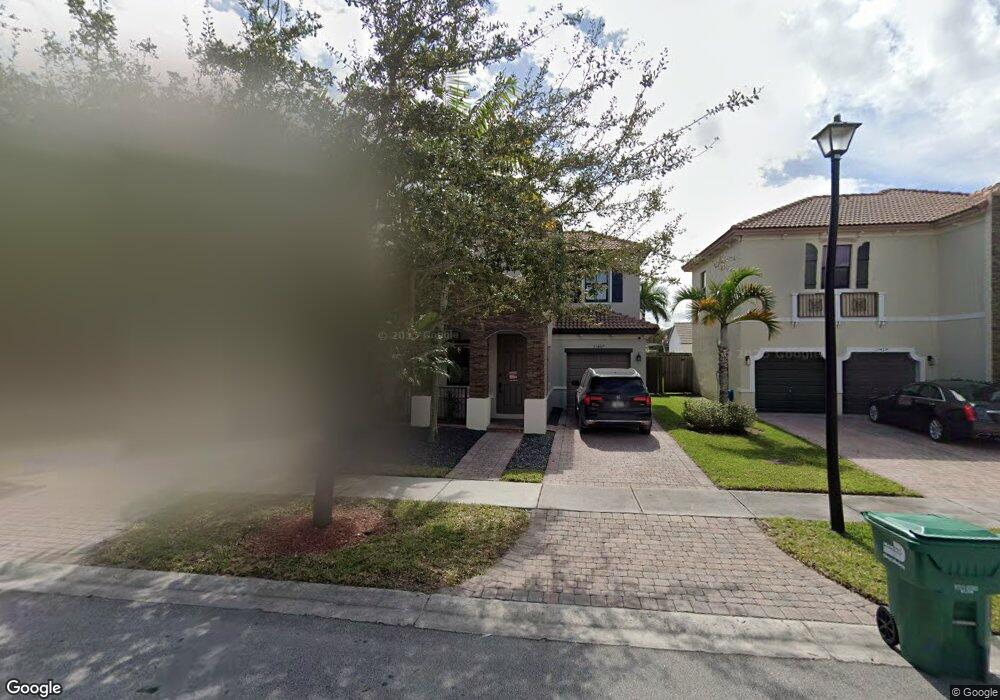
This home is located at 11460 11460 Sw 243 Te, Miami, FL 33032 and is currently estimated at $601,722, approximately $241 per square foot. 11460 11460 Sw 243 Te is a home located in Miami-Dade County with nearby schools including Coconut Palm K-8 Academy, Arthur And Polly Mays Conservatory Of The Arts, and Redland Middle School.
Ownership History
Date
Name
Owned For
Owner Type
Purchase Details
Closed on
Jul 9, 2019
Sold by
Robinson Bernard and Robinson Danielle
Bought by
Charris Karen and Matos Kelvin A
Current Estimated Value
Purchase Details
Closed on
Jun 3, 2016
Sold by
Last Investment Inc
Bought by
Robinson Bernard and Robinson Danielle
Home Financials for this Owner
Home Financials are based on the most recent Mortgage that was taken out on this home.
Original Mortgage
$301,342
Interest Rate
3.66%
Mortgage Type
VA
Purchase Details
Closed on
Dec 10, 2014
Sold by
Dominguez Boanerges
Bought by
Last Investment Inc
Purchase Details
Closed on
Oct 20, 2006
Sold by
Lennar Homes Inc
Bought by
Dominguez Boanerges
Home Financials for this Owner
Home Financials are based on the most recent Mortgage that was taken out on this home.
Original Mortgage
$284,750
Interest Rate
5.37%
Mortgage Type
Unknown
Create a Home Valuation Report for This Property
The Home Valuation Report is an in-depth analysis detailing your home's value as well as a comparison with similar homes in the area
Home Values in the Area
Average Home Value in this Area
Purchase History
| Date | Buyer | Sale Price | Title Company |
|---|---|---|---|
| Charris Karen | $325,000 | Cmp Title & Escrow Svcs Inc | |
| Robinson Bernard | $295,000 | Attorney | |
| Last Investment Inc | $215,000 | Attorney | |
| Dominguez Boanerges | $356,000 | North American Title Company |
Source: Public Records
Mortgage History
| Date | Status | Borrower | Loan Amount |
|---|---|---|---|
| Previous Owner | Robinson Bernard | $301,342 | |
| Previous Owner | Dominguez Boanerges | $284,750 |
Source: Public Records
Tax History Compared to Growth
Tax History
| Year | Tax Paid | Tax Assessment Tax Assessment Total Assessment is a certain percentage of the fair market value that is determined by local assessors to be the total taxable value of land and additions on the property. | Land | Improvement |
|---|---|---|---|---|
| 2025 | $8,021 | $296,026 | -- | -- |
| 2024 | $7,797 | $287,684 | -- | -- |
| 2023 | $7,797 | $279,305 | $0 | $0 |
| 2022 | $7,615 | $271,170 | $0 | $0 |
| 2021 | $7,558 | $263,272 | $0 | $0 |
| 2020 | $7,049 | $259,638 | $50,000 | $209,638 |
| 2019 | $7,809 | $262,047 | $50,000 | $212,047 |
| 2018 | $6,397 | $233,347 | $0 | $0 |
| 2017 | $6,506 | $228,548 | $0 | $0 |
| 2016 | $5,476 | $172,502 | $0 | $0 |
| 2015 | $5,138 | $156,820 | $0 | $0 |
| 2014 | $4,978 | $140,959 | $0 | $0 |
Source: Public Records
Map
Nearby Homes
- 24306 SW 113 Passage
- 24241 SW 113 Passage
- 11640 SW 243rd St
- 24107 SW 114th Ct
- 11333 SW 243rd Terrace
- 11623 SW 244th Ln
- 24162 SW 115th Ct
- 24257 SW 117th Ave
- 24080 SW 115th Ave
- 11914 SW 241st St
- 23900 SW 117th Ct
- 24042 SW 114th Place
- 11587 SW 246 Terrace
- 11371 SW 246th Terrace
- 11487 SW 247 St
- 11732 SW 243rd St
- 24557 SW 117th Ave
- 11331 SW 240th Ln
- 11239 SW 243rd Terrace
- 11381 SW 247th Terrace
- 11460 SW 243rd Terrace
- 11459 SW 243 Terrace
- 11459 SW 243rd Terrace
- 11459 SW 243rd Terrace Unit 1
- 11464 SW 243rd Terrace
- 24331 SW 114th Path
- 11464 SW 243 Te
- 11451 SW 243rd Terrace
- 11468 SW 243 Te
- 11444 SW 243rd Terrace
- 11468 SW 243rd Terrace
- 24321 SW 114th Path
- 11451 SW 244 Te Unit 4/62
- 11451 SW 244 Te
- 11451 SW 244th Terrace
- 11436 SW 243rd Terrace
- 24311 SW 114 Pa
- 11435 SW 243 Te