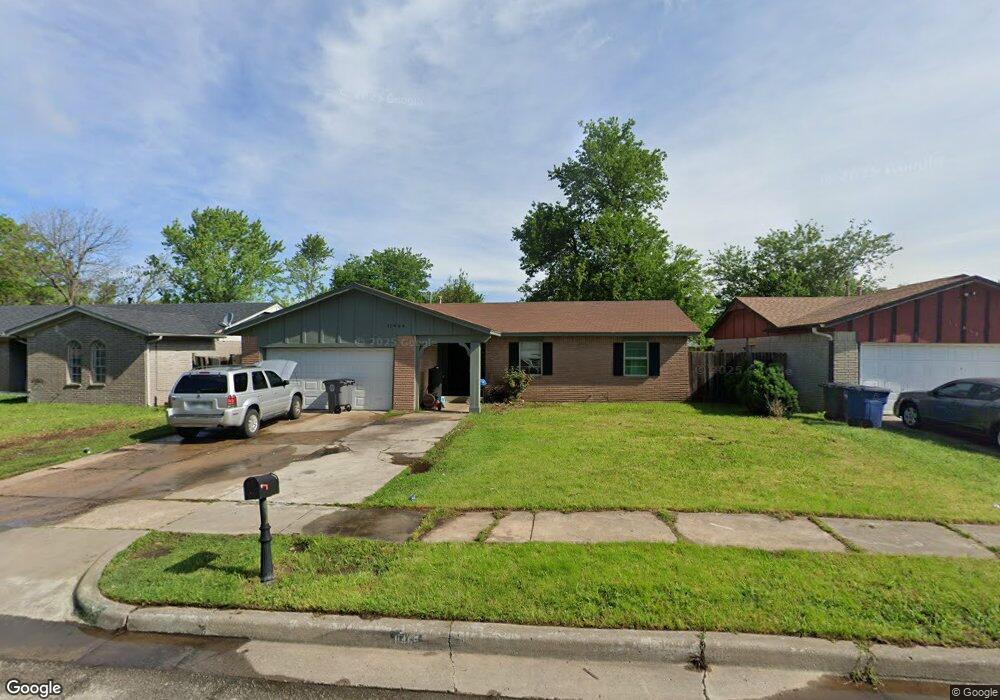
11465 E 38th St Tulsa, OK 74146
Park Plaza East NeighborhoodEstimated Value: $145,000 - $154,000
3
Beds
1
Bath
1,136
Sq Ft
$132/Sq Ft
Est. Value
About This Home
This home is located at 11465 E 38th St, Tulsa, OK 74146 and is currently estimated at $150,000, approximately $132 per square foot. 11465 E 38th St is a home located in Tulsa County with nearby schools including Ellen Ochoa Elementary School, Union 8th Grade Center, and Union 6th-7th Grade Center.
Ownership History
Date
Name
Owned For
Owner Type
Purchase Details
Closed on
Apr 27, 2016
Sold by
Huestone Properties Llc
Bought by
Pietz Kathleen and Pietz David
Current Estimated Value
Home Financials for this Owner
Home Financials are based on the most recent Mortgage that was taken out on this home.
Original Mortgage
$60,000
Outstanding Balance
$25,609
Interest Rate
3.73%
Mortgage Type
Commercial
Estimated Equity
$124,391
Purchase Details
Closed on
Mar 21, 2008
Sold by
Hud
Bought by
Bluestone Properties Llc
Home Financials for this Owner
Home Financials are based on the most recent Mortgage that was taken out on this home.
Original Mortgage
$69,126
Interest Rate
6.11%
Mortgage Type
Purchase Money Mortgage
Purchase Details
Closed on
Feb 11, 2000
Sold by
Hughes Alven Ray and Hughes Wilma Jean
Bought by
Wallace Dale Wayne and Wallace Mary Lisa
Create a Home Valuation Report for This Property
The Home Valuation Report is an in-depth analysis detailing your home's value as well as a comparison with similar homes in the area
Home Values in the Area
Average Home Value in this Area
Purchase History
| Date | Buyer | Sale Price | Title Company |
|---|---|---|---|
| Pietz Kathleen | $75,000 | Guaranty Abstract Co | |
| Bluestone Properties Llc | -- | None Available | |
| Wallace Dale Wayne | $60,000 | -- |
Source: Public Records
Mortgage History
| Date | Status | Borrower | Loan Amount |
|---|---|---|---|
| Open | Pietz Kathleen | $60,000 | |
| Previous Owner | Bluestone Properties Llc | $69,126 |
Source: Public Records
Tax History
| Year | Tax Paid | Tax Assessment Tax Assessment Total Assessment is a certain percentage of the fair market value that is determined by local assessors to be the total taxable value of land and additions on the property. | Land | Improvement |
|---|---|---|---|---|
| 2025 | $1,427 | $10,435 | $2,464 | $7,971 |
| 2024 | $1,210 | $9,938 | $1,839 | $8,099 |
| 2023 | $1,210 | $9,464 | $1,856 | $7,608 |
| 2022 | $1,201 | $9,014 | $2,608 | $6,406 |
| 2021 | $1,158 | $8,585 | $2,484 | $6,101 |
| 2020 | $1,142 | $8,585 | $2,484 | $6,101 |
| 2019 | $1,182 | $8,585 | $2,484 | $6,101 |
| 2018 | $1,133 | $8,250 | $2,387 | $5,863 |
| 2017 | $1,140 | $8,250 | $2,387 | $5,863 |
| 2016 | $1,149 | $8,503 | $2,497 | $6,006 |
| 2015 | $1,161 | $8,503 | $2,497 | $6,006 |
| 2014 | $1,143 | $8,503 | $2,497 | $6,006 |
Source: Public Records
Map
Nearby Homes
- 11502 E 37th St
- 3607 S 118th East Ave
- 3431 S 116th East Place
- 3430 S 116th East Place
- 11644 E 34th St
- 10932 E 37th St
- 4030 S 118th East Ave
- 12111 E 36th St
- 3347 S 120th East Place
- 10884 E 33rd Ct
- 3923 S 122nd Ave E
- 12404 E 35th St
- 3118 S 115th East Ave
- 3914 S 125th East Ave
- 12517 E 38th St
- 12624 E 33rd Ct
- 9751 E 31st St
- 3204 S 128th East Ave
- 2926 S 122nd East Ave
- 10775 E 29th Place
- 11469 E 38th St
- 11459 E 38th St
- 11462 E 37th Place
- 11455 E 38th St
- 11475 E 38th St
- 11468 E 37th Place
- 11458 E 37th Place
- 11452 E 37th Place
- 11466 E 38th St
- 11472 E 37th Place
- 11460 E 38th St
- 11470 E 38th St
- 11451 E 38th St
- 11456 E 38th St
- 11476 E 38th St
- 11448 E 37th Place
- 11452 E 38th St
- 11445 E 38th St
- 11807 E 38th St
- 11802 E 38th St
Your Personal Tour Guide
Ask me questions while you tour the home.