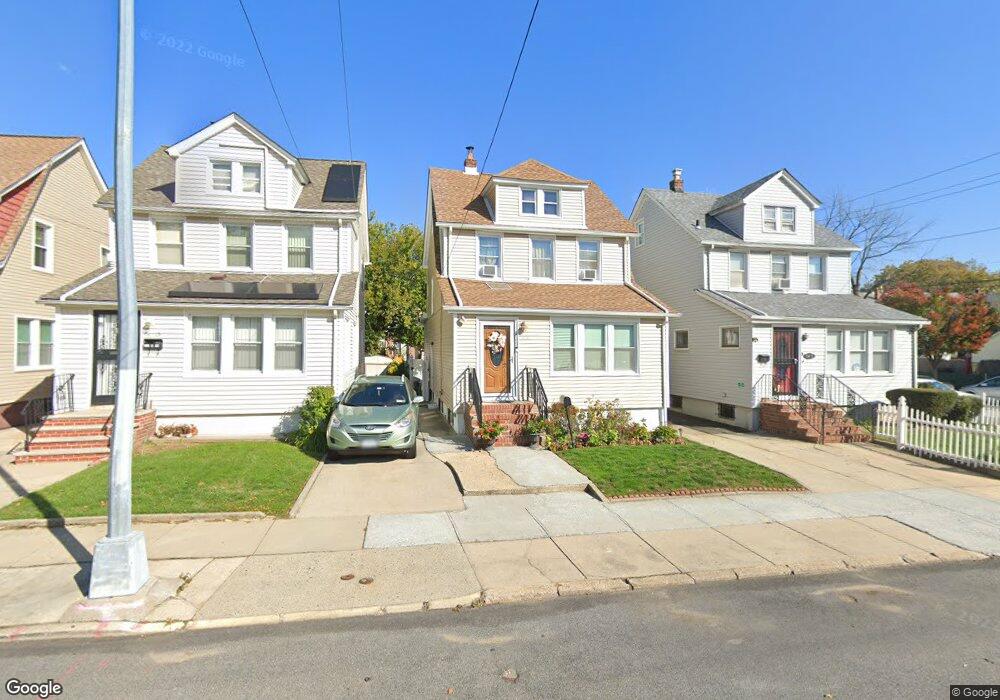
11469 196th St Saint Albans, NY 11412
Saint Albans NeighborhoodEstimated Value: $673,000 - $832,000
--
Bed
--
Bath
1,564
Sq Ft
$475/Sq Ft
Est. Value
About This Home
This home is located at 11469 196th St, Saint Albans, NY 11412 and is currently estimated at $742,909, approximately $475 per square foot. 11469 196th St is a home located in Queens County with nearby schools including P.S. 136 Roy Wilkins, I.S. 192 The Linden, and Riverton Street Charter School.
Ownership History
Date
Name
Owned For
Owner Type
Purchase Details
Closed on
Apr 27, 2017
Sold by
Perek 92 Llc
Bought by
Garib Janett Joy and Miller Calbert
Current Estimated Value
Home Financials for this Owner
Home Financials are based on the most recent Mortgage that was taken out on this home.
Original Mortgage
$510,581
Outstanding Balance
$426,116
Interest Rate
4.23%
Mortgage Type
Purchase Money Mortgage
Estimated Equity
$316,793
Purchase Details
Closed on
Dec 28, 2016
Sold by
Johnstone Associates Ny Llc
Bought by
Perek 92 Llc
Home Financials for this Owner
Home Financials are based on the most recent Mortgage that was taken out on this home.
Original Mortgage
$350,000
Interest Rate
4.03%
Mortgage Type
Purchase Money Mortgage
Purchase Details
Closed on
Sep 14, 2016
Sold by
Alexander Neva
Bought by
Johnstone Associates Ny Llc
Purchase Details
Closed on
Jun 22, 2001
Sold by
Nurse Helen Reid
Bought by
Alexander Neva
Home Financials for this Owner
Home Financials are based on the most recent Mortgage that was taken out on this home.
Original Mortgage
$182,000
Interest Rate
7.14%
Create a Home Valuation Report for This Property
The Home Valuation Report is an in-depth analysis detailing your home's value as well as a comparison with similar homes in the area
Home Values in the Area
Average Home Value in this Area
Purchase History
| Date | Buyer | Sale Price | Title Company |
|---|---|---|---|
| Garib Janett Joy | $520,000 | -- | |
| Perek 92 Llc | $333,500 | -- | |
| Johnstone Associates Ny Llc | $250,000 | -- | |
| Alexander Neva | -- | -- |
Source: Public Records
Mortgage History
| Date | Status | Borrower | Loan Amount |
|---|---|---|---|
| Open | Garib Janett Joy | $510,581 | |
| Previous Owner | Perek 92 Llc | $350,000 | |
| Previous Owner | Alexander Neva | $182,000 |
Source: Public Records
Tax History Compared to Growth
Tax History
| Year | Tax Paid | Tax Assessment Tax Assessment Total Assessment is a certain percentage of the fair market value that is determined by local assessors to be the total taxable value of land and additions on the property. | Land | Improvement |
|---|---|---|---|---|
| 2025 | $5,949 | $31,393 | $8,488 | $22,905 |
| 2024 | $5,949 | $29,617 | $8,572 | $21,045 |
| 2023 | $5,678 | $28,272 | $7,201 | $21,071 |
| 2022 | $5,325 | $37,080 | $11,340 | $25,740 |
| 2021 | $5,613 | $32,040 | $11,340 | $20,700 |
| 2020 | $5,538 | $35,220 | $11,340 | $23,880 |
| 2019 | $5,163 | $31,800 | $11,340 | $20,460 |
| 2018 | $4,803 | $23,560 | $8,629 | $14,931 |
| 2017 | $4,531 | $22,227 | $9,679 | $12,548 |
| 2016 | $4,443 | $22,227 | $9,679 | $12,548 |
| 2015 | $2,309 | $21,801 | $11,985 | $9,816 |
| 2014 | $2,309 | $20,568 | $10,639 | $9,929 |
Source: Public Records
Map
Nearby Homes
- 115-37 197th St
- 194-34 115th Rd
- 114-64 198th St
- 194-19 115th Rd
- 19705 116th Ave
- 11516 199th St
- 196-10 116th Ave
- 114-22 197th St
- 114-28 198th St
- 11608 196th St
- 191-68 115th Rd
- 115-47 199th St
- 19431 114th Rd
- 194-56 Murdock Ave
- 194-23 114th Rd
- 114-37 199th St
- 194-42 Murdock Ave
- 191-47 114th Dr
- 114-40 200th St
- 19445 Murdock Ave
- 11469 196th St
- 11471 196th St
- 11465 196th St
- 11463 196th St
- 11459 196th St
- 11468 197th St
- 11466 197th St
- 11466 197th St Unit 2nd Fl
- 114-70 197th St
- 11470 197th St
- 11464 197th St
- 114-66 197th St
- 11462 197th St
- 11501 196th St
- 11457 196th St
- 11460 197th St
- 115-01 196th St
- 114-64 197th St
- 114-60 197th St
- 11458 197th St