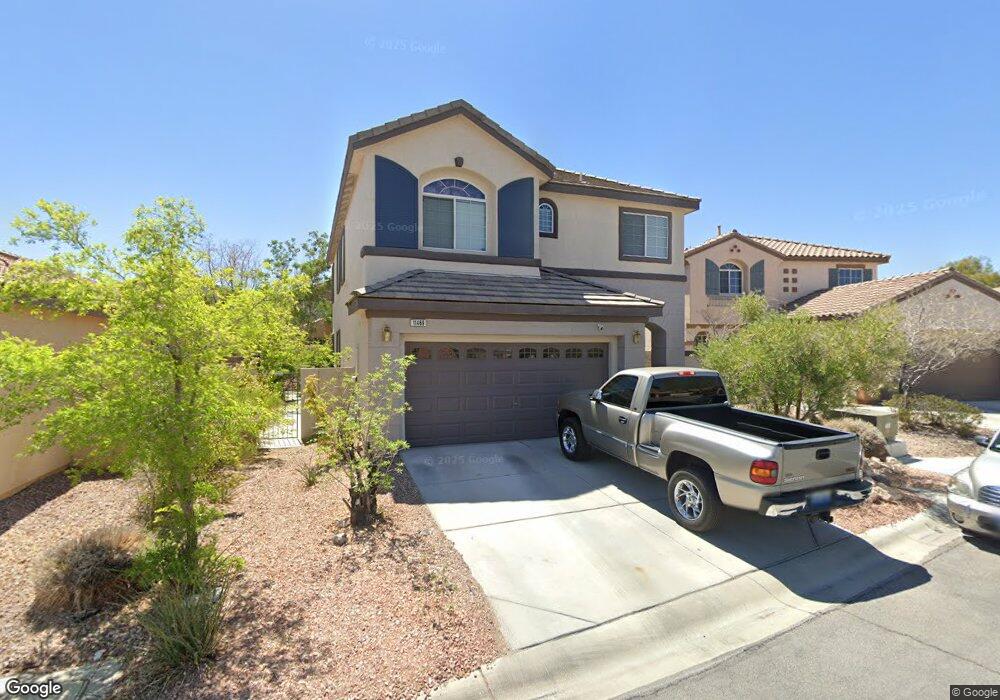
11469 Drappo Ave Las Vegas, NV 89138
Estimated Value: $586,000 - $616,000
3
Beds
3
Baths
1,922
Sq Ft
$313/Sq Ft
Est. Value
About This Home
This home is located at 11469 Drappo Ave, Las Vegas, NV 89138 and is currently estimated at $601,605, approximately $313 per square foot. 11469 Drappo Ave is a home located in Clark County with nearby schools including Linda Rankin Givens Elementary School, Sig Rogich Middle School, and Palo Verde High School.
Ownership History
Date
Name
Owned For
Owner Type
Purchase Details
Closed on
Sep 29, 2021
Sold by
Jones Jonathan T
Bought by
Jones Jonathan Trent and Jones Nicole Moore
Current Estimated Value
Purchase Details
Closed on
Oct 5, 2018
Sold by
Neering Nicole Moure
Bought by
Jones Jonathan T
Home Financials for this Owner
Home Financials are based on the most recent Mortgage that was taken out on this home.
Original Mortgage
$372,400
Outstanding Balance
$324,755
Interest Rate
4.5%
Mortgage Type
New Conventional
Estimated Equity
$276,850
Purchase Details
Closed on
Feb 12, 2004
Sold by
Talega Llc
Bought by
Tsou Frank F and Erdley Cherylayne H
Home Financials for this Owner
Home Financials are based on the most recent Mortgage that was taken out on this home.
Original Mortgage
$236,590
Interest Rate
3.75%
Mortgage Type
Credit Line Revolving
Create a Home Valuation Report for This Property
The Home Valuation Report is an in-depth analysis detailing your home's value as well as a comparison with similar homes in the area
Home Values in the Area
Average Home Value in this Area
Purchase History
| Date | Buyer | Sale Price | Title Company |
|---|---|---|---|
| Jones Jonathan Trent | -- | None Available | |
| Jones Jonathan T | -- | Fidelity National Title | |
| Jones Jonathan T | $392,000 | Fidelity National Title | |
| Tsou Frank F | $295,740 | United Title Of Nevada |
Source: Public Records
Mortgage History
| Date | Status | Borrower | Loan Amount |
|---|---|---|---|
| Open | Jones Jonathan T | $372,400 | |
| Previous Owner | Tsou Frank F | $236,590 |
Source: Public Records
Tax History Compared to Growth
Tax History
| Year | Tax Paid | Tax Assessment Tax Assessment Total Assessment is a certain percentage of the fair market value that is determined by local assessors to be the total taxable value of land and additions on the property. | Land | Improvement |
|---|---|---|---|---|
| 2025 | $3,060 | $138,362 | $54,250 | $84,112 |
| 2024 | $2,780 | $138,362 | $54,250 | $84,112 |
| 2023 | $2,263 | $121,228 | $41,650 | $79,578 |
| 2022 | $2,699 | $106,607 | $33,950 | $72,657 |
| 2021 | $2,619 | $100,573 | $31,500 | $69,073 |
| 2020 | $2,539 | $100,432 | $32,200 | $68,232 |
| 2019 | $2,507 | $94,189 | $27,300 | $66,889 |
| 2018 | $2,390 | $87,273 | $23,100 | $64,173 |
| 2017 | $2,890 | $87,970 | $23,100 | $64,870 |
| 2016 | $2,263 | $81,517 | $16,800 | $64,717 |
| 2015 | $2,258 | $73,044 | $15,050 | $57,994 |
| 2014 | $2,192 | $64,662 | $9,450 | $55,212 |
Source: Public Records
Map
Nearby Homes
- 1020 Puerta Del Sol Dr
- 11625 Cabo Del Verde Ave
- 1164 Prospering Creek St
- 1163 Blossom Point St
- 1181 Blossom Point St
- 1187 Blossom Point St Unit 36
- 11485 Vibrant Heights Dr Unit 32
- 11441 Allerton Park Dr Unit 212
- 11441 Allerton Park Dr Unit 206
- 11441 Allerton Park Dr Unit 213
- 11441 Allerton Park Dr Unit 214
- 11329 Hedgemont Ave
- 11655 Suburban Rd
- 1064 Calvia St
- 929 Viscanio Place
- 1510 Plaza Centre Dr Unit 105
- 11620 Longhirst Hall Ln
- 11379 Gravitation Dr
- 858 La Sconsa Dr
- 873 Roseberry Dr
- 11465 Drappo Ave
- 11473 Drappo Ave
- 11461 Drappo Ave
- 11461 Drappo Ave Unit non
- 11476 Parkersburg Ave Unit 2
- 11472 Parkersburg Ave
- 1045 Newbold St
- 11468 Parkersburg Ave
- 1040 Newbold St Unit 1
- 11480 Parkersburg Ave
- 11464 Parkersburg Ave Unit 2
- 11457 Drappo Ave
- 1041 Newbold St
- 11460 Parkersburg Ave
- 11460 Drappo Ave
- 11484 Parkersburg Ave
- 1036 Newbold St
- 1037 Newbold St
- 1037 Newbold St Unit none
- 11456 Parkersburg Ave