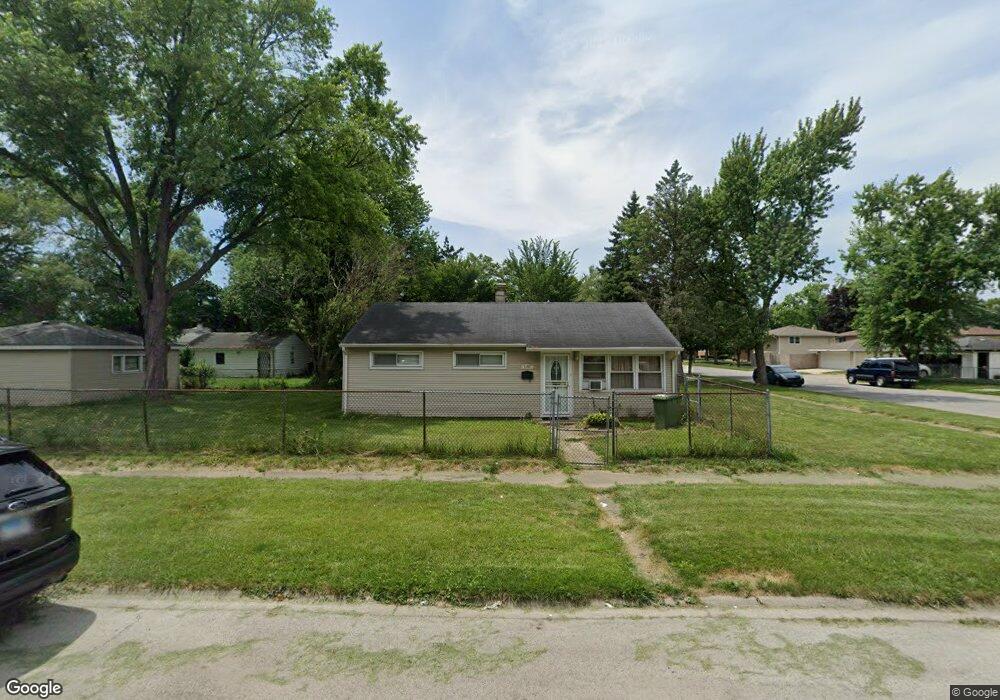
1147 E 146th St Dolton, IL 60419
Estimated Value: $109,085 - $150,000
3
Beds
1
Bath
906
Sq Ft
$143/Sq Ft
Est. Value
About This Home
This home is located at 1147 E 146th St, Dolton, IL 60419 and is currently estimated at $129,271, approximately $142 per square foot. 1147 E 146th St is a home located in Cook County with nearby schools including Berger-Vandenberg Elementary School, Creative Communications Academy, and School Of Fine Arts Academy.
Ownership History
Date
Name
Owned For
Owner Type
Purchase Details
Closed on
Jul 31, 2008
Sold by
Liquidation Properties Inc
Bought by
Ars Capital Investments Llc
Current Estimated Value
Home Financials for this Owner
Home Financials are based on the most recent Mortgage that was taken out on this home.
Original Mortgage
$43,200
Interest Rate
6.52%
Mortgage Type
Purchase Money Mortgage
Purchase Details
Closed on
Jun 10, 2008
Sold by
Citigroup Global Markets Realty Corp
Bought by
Liquidation Properties Inc
Home Financials for this Owner
Home Financials are based on the most recent Mortgage that was taken out on this home.
Original Mortgage
$43,200
Interest Rate
6.52%
Mortgage Type
Purchase Money Mortgage
Purchase Details
Closed on
Jun 29, 2007
Sold by
Fuller Winslow
Bought by
Citigroup Global Markets Realty Corp
Create a Home Valuation Report for This Property
The Home Valuation Report is an in-depth analysis detailing your home's value as well as a comparison with similar homes in the area
Home Values in the Area
Average Home Value in this Area
Purchase History
| Date | Buyer | Sale Price | Title Company |
|---|---|---|---|
| Ars Capital Investments Llc | $13,000 | 1St American Title | |
| Liquidation Properties Inc | -- | First American Title Ins Co | |
| Citigroup Global Markets Realty Corp | -- | First American Title Ins Co |
Source: Public Records
Mortgage History
| Date | Status | Borrower | Loan Amount |
|---|---|---|---|
| Previous Owner | Ars Capital Investments Llc | $43,200 |
Source: Public Records
Tax History
| Year | Tax Paid | Tax Assessment Tax Assessment Total Assessment is a certain percentage of the fair market value that is determined by local assessors to be the total taxable value of land and additions on the property. | Land | Improvement |
|---|---|---|---|---|
| 2025 | $2,463 | $4,367 | $1,562 | $2,805 |
| 2024 | $2,463 | $4,367 | $1,562 | $2,805 |
| 2023 | $1,825 | $4,367 | $1,562 | $2,805 |
| 2022 | $1,825 | $2,521 | $1,378 | $1,143 |
| 2021 | $1,736 | $2,521 | $1,378 | $1,143 |
| 2020 | $624 | $2,521 | $1,378 | $1,143 |
| 2019 | $1,061 | $3,170 | $1,286 | $1,884 |
| 2018 | $1,055 | $3,170 | $1,286 | $1,884 |
| 2017 | $1,019 | $3,170 | $1,286 | $1,884 |
| 2016 | $1,241 | $3,196 | $1,194 | $2,002 |
| 2015 | $1,160 | $3,196 | $1,194 | $2,002 |
| 2014 | $1,162 | $3,196 | $1,194 | $2,002 |
| 2013 | $1,225 | $3,462 | $1,194 | $2,268 |
Source: Public Records
Map
Nearby Homes
- 14635 Woodlawn Ave
- 14708 Shepard Dr
- 14720 Shepard Dr
- 1107 E 145th St
- 14525 Dobson Ave
- 14761 Lincoln Ave
- 14658 Lincoln Ave
- 14631 Lincoln Ave
- 14637 Kenwood Ave
- 14521 Kenwood Ave
- 14731 Kimbark Ave
- 14737 Kimbark Ave
- 14405 Woodlawn Ave
- 14341 University Ave
- 1425 Kasten Dr
- 14417 Dorchester Ave
- 14428 Dante Ave
- 14738 Dante Ave
- 14610 Blackstone Ave
- 14315 Dobson Ave
- 1143 E 146th St
- 1139 E 146th St
- 1139 E 146th St
- 14614 Woodlawn Ave
- 14614 Woodlawn Ave
- 1135 E 146th St
- 1135 E 146th St
- 14544 Woodlawn Ave
- 14605 Woodlawn Ave
- 14603 Woodlawn Ave
- 14618 Woodlawn Ave
- 14618 Woodlawn Ave
- 14609 Woodlawn Ave
- 14542 Woodlawn Ave
- 14613 University Ave
- 1131 E 146th St
- 1131 E 146th St
- 14613 Woodlawn Ave
- 14613 Woodlawn Ave
- 14615 University Ave
Your Personal Tour Guide
Ask me questions while you tour the home.