Estimated Value: $265,000 - $319,000
3
Beds
2
Baths
1,206
Sq Ft
$235/Sq Ft
Est. Value
About This Home
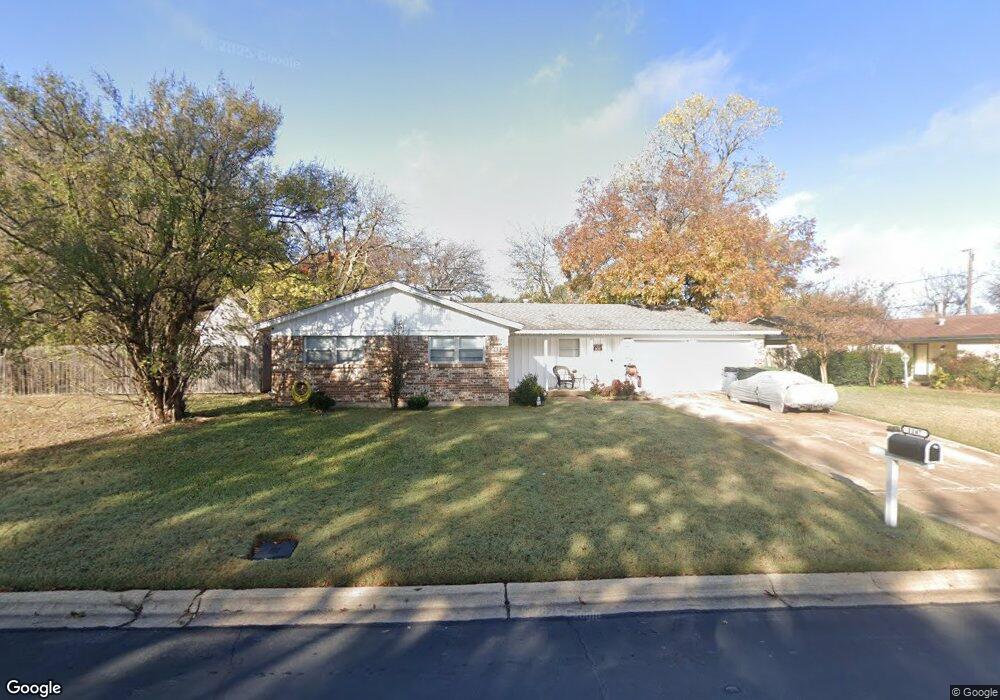
This home is located at 1147 Harrison Ln, Hurst, TX 76053 and is currently estimated at $283,158, approximately $234 per square foot. 1147 Harrison Ln is a home located in Tarrant County with nearby schools including Harrison Lane Elementary School, Hurst J High School, and L.D. Bell High School.
Ownership History
Date
Name
Owned For
Owner Type
Purchase Details
Closed on
Apr 2, 2019
Sold by
Westrom Jon
Bought by
Garcia Jimmy Torres
Current Estimated Value
Home Financials for this Owner
Home Financials are based on the most recent Mortgage that was taken out on this home.
Original Mortgage
$184,300
Outstanding Balance
$162,032
Interest Rate
4.3%
Mortgage Type
Purchase Money Mortgage
Estimated Equity
$121,126
Purchase Details
Closed on
Jan 7, 2019
Sold by
Harter Dennis R
Bought by
Westrom Jon
Home Financials for this Owner
Home Financials are based on the most recent Mortgage that was taken out on this home.
Original Mortgage
$126,000
Interest Rate
4.8%
Mortgage Type
Purchase Money Mortgage
Purchase Details
Closed on
Jan 3, 2019
Sold by
Sharber Michael Lance
Bought by
Harter Dennis R
Home Financials for this Owner
Home Financials are based on the most recent Mortgage that was taken out on this home.
Original Mortgage
$126,000
Interest Rate
4.8%
Mortgage Type
Purchase Money Mortgage
Create a Home Valuation Report for This Property
The Home Valuation Report is an in-depth analysis detailing your home's value as well as a comparison with similar homes in the area
Home Values in the Area
Average Home Value in this Area
Purchase History
| Date | Buyer | Sale Price | Title Company |
|---|---|---|---|
| Garcia Jimmy Torres | -- | Providence Title Company | |
| Westrom Jon | -- | Tiago Title Llc | |
| Harter Dennis R | -- | Tiago Title Llc |
Source: Public Records
Mortgage History
| Date | Status | Borrower | Loan Amount |
|---|---|---|---|
| Open | Garcia Jimmy Torres | $184,300 | |
| Previous Owner | Westrom Jon | $126,000 |
Source: Public Records
Tax History Compared to Growth
Tax History
| Year | Tax Paid | Tax Assessment Tax Assessment Total Assessment is a certain percentage of the fair market value that is determined by local assessors to be the total taxable value of land and additions on the property. | Land | Improvement |
|---|---|---|---|---|
| 2025 | $5,948 | $291,188 | $55,000 | $236,188 |
| 2024 | $5,948 | $291,188 | $55,000 | $236,188 |
| 2023 | $5,557 | $277,365 | $40,000 | $237,365 |
| 2022 | $5,612 | $243,729 | $40,000 | $203,729 |
| 2021 | $5,610 | $232,623 | $40,000 | $192,623 |
| 2020 | $4,572 | $190,025 | $40,000 | $150,025 |
| 2019 | $2,910 | $154,556 | $40,000 | $114,556 |
| 2018 | $949 | $108,077 | $19,000 | $89,077 |
| 2017 | $2,486 | $139,185 | $19,000 | $120,185 |
| 2016 | $2,260 | $129,788 | $19,000 | $110,788 |
| 2015 | $1,013 | $81,200 | $15,000 | $66,200 |
| 2014 | $1,013 | $81,200 | $15,000 | $66,200 |
Source: Public Records
Map
Nearby Homes
- 1136 Simpson Dr
- 1220 Norwood Dr
- 409 Vicki Place
- 420 Bedford Ct W
- 1016 Keith Dr
- 1337 Harrison Ln
- 905 Brown Trail
- 116 Oakhurst Dr
- 400 Joanna Dr
- 1348 Norwood Dr
- 1352 Simpson Dr
- 1208 Karla Dr
- 344 Bedford Ct E
- 341 Hurst Dr
- 802 Brown Trail
- 803 Glenda Dr
- 127 W Cedar St
- 113 Sunnyvale Terrace
- 1208 Birch St
- 1008 Russell Ln
- 1149 Harrison Ln
- 1145 Harrison Ln
- 1148 Harrison Ln
- 205 Olive St
- 209 Olive St
- 140 Bedford Ct W
- 1152 Harrison Ln
- 1144 Harrison Ln
- 201 Olive St
- 213 Olive St
- 1156 Harrison Ln
- 217 Olive St
- 148 Bedford Ct W
- 1149 Simpson Dr
- 1141 Harrison Ln
- 1145 Simpson Dr
- 1140 Harrison Ln
- 1153 Simpson Dr
- 1136 Mason Dr
- 221 Olive St