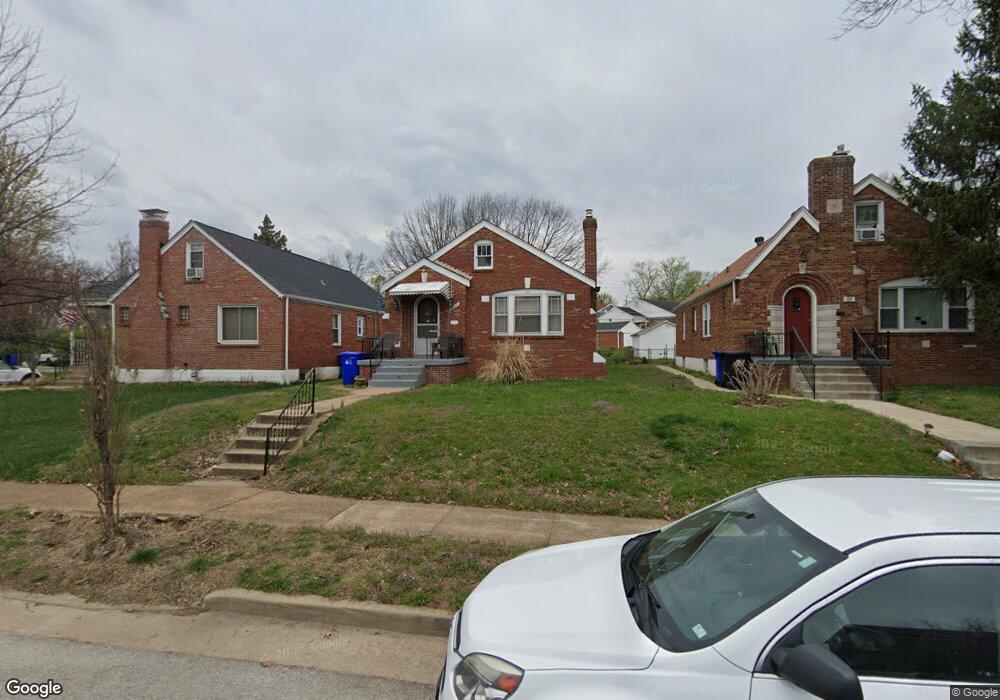
1147 Ursula Ave Saint Louis, MO 63130
Estimated Value: $135,571 - $143,000
2
Beds
1
Bath
1,032
Sq Ft
$135/Sq Ft
Est. Value
About This Home
This home is located at 1147 Ursula Ave, Saint Louis, MO 63130 and is currently estimated at $139,393, approximately $135 per square foot. 1147 Ursula Ave is a home located in St. Louis County with nearby schools including Pershing Elementary School, Brittany Woods Middle School, and University City High School.
Ownership History
Date
Name
Owned For
Owner Type
Purchase Details
Closed on
Jun 18, 2015
Sold by
Makkar Narinder
Bought by
Singh Sandeep and Kaur Kawaljeet
Current Estimated Value
Home Financials for this Owner
Home Financials are based on the most recent Mortgage that was taken out on this home.
Original Mortgage
$44,625
Interest Rate
4.08%
Mortgage Type
New Conventional
Purchase Details
Closed on
Oct 1, 2014
Sold by
Vixen Llc
Bought by
Makkar Narinder
Purchase Details
Closed on
Sep 5, 2014
Sold by
Smith Dorothy J
Bought by
Vixen Llc
Purchase Details
Closed on
Jan 8, 1997
Sold by
Lorenzo Washington and Washington Lillian D
Bought by
Smith Dorothy J
Home Financials for this Owner
Home Financials are based on the most recent Mortgage that was taken out on this home.
Original Mortgage
$45,399
Interest Rate
7.88%
Mortgage Type
FHA
Create a Home Valuation Report for This Property
The Home Valuation Report is an in-depth analysis detailing your home's value as well as a comparison with similar homes in the area
Home Values in the Area
Average Home Value in this Area
Purchase History
| Date | Buyer | Sale Price | Title Company |
|---|---|---|---|
| Singh Sandeep | $59,500 | Title Partners Agency Llc | |
| Makkar Narinder | $30,000 | Resolutions Title Inc | |
| Vixen Llc | $17,501 | Title Partners Agency Llc | |
| Smith Dorothy J | -- | -- |
Source: Public Records
Mortgage History
| Date | Status | Borrower | Loan Amount |
|---|---|---|---|
| Previous Owner | Singh Sandeep | $44,625 | |
| Previous Owner | Smith Dorothy J | $45,399 |
Source: Public Records
Tax History Compared to Growth
Tax History
| Year | Tax Paid | Tax Assessment Tax Assessment Total Assessment is a certain percentage of the fair market value that is determined by local assessors to be the total taxable value of land and additions on the property. | Land | Improvement |
|---|---|---|---|---|
| 2025 | $1,790 | $22,760 | $5,700 | $17,060 |
| 2024 | $1,790 | $24,700 | $9,500 | $15,200 |
| 2023 | $1,788 | $24,700 | $9,500 | $15,200 |
| 2022 | $1,435 | $18,350 | $4,940 | $13,410 |
| 2021 | $1,421 | $18,350 | $4,940 | $13,410 |
| 2020 | $1,329 | $16,680 | $5,700 | $10,980 |
| 2019 | $1,316 | $16,680 | $5,700 | $10,980 |
| 2018 | $1,192 | $13,910 | $4,940 | $8,970 |
| 2017 | $1,194 | $13,910 | $4,940 | $8,970 |
| 2016 | $1,144 | $12,730 | $3,420 | $9,310 |
| 2015 | $1,149 | $12,730 | $3,420 | $9,310 |
| 2014 | $1,032 | $11,180 | $2,190 | $8,990 |
Source: Public Records
Map
Nearby Homes
- 6736 Julian Ave
- 6731 Crest Ave
- 6570 Corbitt Ave
- 6568 Plymouth Ave
- 6835 Etzel Ave
- 6817 Crest Ave
- 6759 Raymond Ave
- 6540 Avalon Ave
- 6757 Raymond Ave
- 6719 Raymond Ave
- 6603 Etzel Ave
- 6821 Raymond Ave
- 6721 Chamberlain Ave
- 6922 Plymouth Ave
- 6934 Julian Ave
- 6624 Bartmer Ave
- 6516 Etzel Ave
- 6534 Whitney Ave
- 6512 Etzel Ave
- 1268 Kingsland Ave
- 1151 Ursula Ave
- 1145 Ursula Ave
- 1153 Ursula Ave
- 6757 Corbitt Ave
- 1157 Ursula Ave
- 6761 Corbitt Ave
- 1161 Ursula Ave
- 1133 Ursula Ave
- 1146 Ursula Ave
- 1152 Ursula Ave
- 1140 Ursula Ave
- 1165 Ursula Ave
- 6765 Corbitt Ave
- 1156 Ursula Ave
- 1129 Ursula Ave
- 6750 Corbitt Ave
- 6754 Corbitt Ave
- 1136 Ursula Ave
- 6746 Corbitt Ave
- 6756 Corbitt Ave