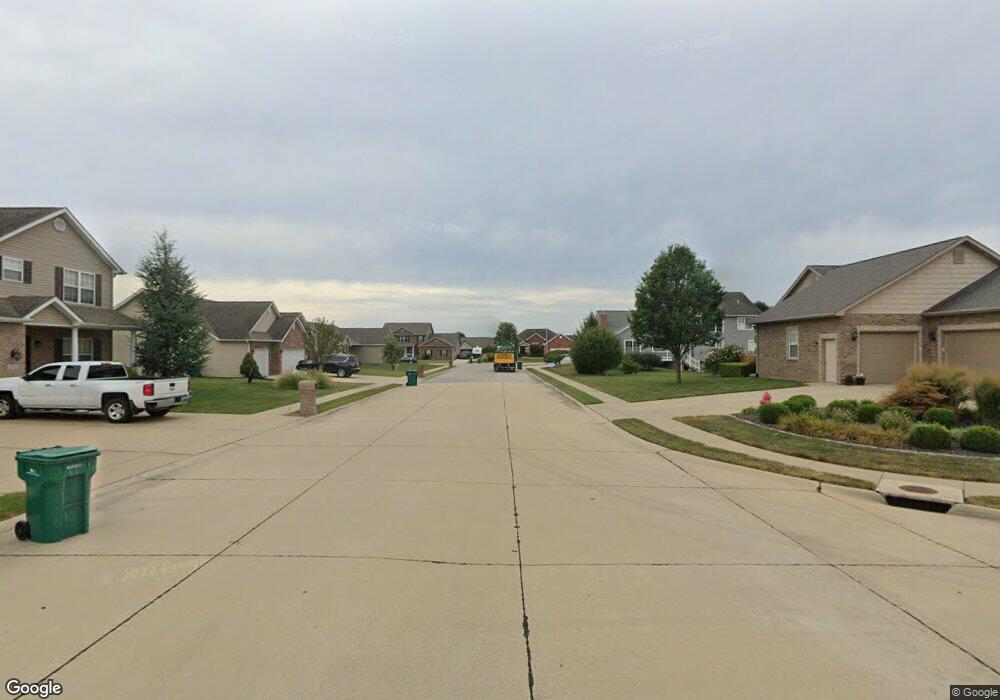
1147 Whimbrel Run Mascoutah, IL 62258
Estimated Value: $493,000 - $561,000
Studio
--
Bath
1,332
Sq Ft
$388/Sq Ft
Est. Value
About This Home
This home is located at 1147 Whimbrel Run, Mascoutah, IL 62258 and is currently estimated at $516,270, approximately $387 per square foot. 1147 Whimbrel Run is a home located in St. Clair County with nearby schools including Mascoutah High School and Holy Childhood of Jesus School.
Ownership History
Date
Name
Owned For
Owner Type
Purchase Details
Closed on
Nov 8, 2012
Sold by
Florek Homes Inc
Bought by
Stewart Baron Keith and Stewart Donna J
Current Estimated Value
Home Financials for this Owner
Home Financials are based on the most recent Mortgage that was taken out on this home.
Original Mortgage
$358,459
Outstanding Balance
$247,819
Interest Rate
3.4%
Mortgage Type
VA
Estimated Equity
$268,451
Purchase Details
Closed on
Mar 12, 2012
Sold by
Florek Homes Inc
Bought by
Rcf Development Llc
Home Financials for this Owner
Home Financials are based on the most recent Mortgage that was taken out on this home.
Original Mortgage
$285,000
Interest Rate
5.75%
Mortgage Type
Construction
Purchase Details
Closed on
Feb 17, 2012
Sold by
Townsend Square Llc
Bought by
Florek Homes Inc C
Home Financials for this Owner
Home Financials are based on the most recent Mortgage that was taken out on this home.
Original Mortgage
$285,000
Interest Rate
5.75%
Mortgage Type
Construction
Create a Home Valuation Report for This Property
The Home Valuation Report is an in-depth analysis detailing your home's value as well as a comparison with similar homes in the area
Purchase History
| Date | Buyer | Sale Price | Title Company |
|---|---|---|---|
| Stewart Baron Keith | $351,000 | Advanced Title Solutions Inc | |
| Florek Homes Inc | -- | Advanced Title Solutions Inc | |
| Rcf Development Llc | -- | Benedick Title Ins | |
| Florek Homes Inc C | -- | Benedict Title Ins |
Source: Public Records
Mortgage History
| Date | Status | Borrower | Loan Amount |
|---|---|---|---|
| Open | Stewart Baron Keith | $358,459 | |
| Previous Owner | Florek Homes Inc C | $285,000 |
Source: Public Records
Tax History
| Year | Tax Paid | Tax Assessment Tax Assessment Total Assessment is a certain percentage of the fair market value that is determined by local assessors to be the total taxable value of land and additions on the property. | Land | Improvement |
|---|---|---|---|---|
| 2024 | -- | $171,451 | $31,358 | $140,093 |
| 2023 | $11,543 | $156,690 | $28,658 | $128,032 |
| 2022 | $11,395 | $142,601 | $26,081 | $116,520 |
| 2021 | $11,412 | $140,514 | $25,261 | $115,253 |
| 2020 | $10,922 | $131,802 | $23,694 | $108,108 |
| 2019 | $10,663 | $131,802 | $23,694 | $108,108 |
| 2018 | $10,435 | $128,262 | $23,058 | $105,204 |
| 2017 | $10,200 | $119,989 | $22,600 | $97,389 |
| 2016 | $10,091 | $118,263 | $22,275 | $95,988 |
| 2014 | $8,944 | $115,559 | $21,766 | $93,793 |
| 2013 | $26 | $113,920 | $21,457 | $92,463 |
Source: Public Records
Map
Nearby Homes
- 7 Hunters Trail
- 9640 Mallard Dr
- 1192 Widgeon Dr
- 1113 Menominee Trail
- 1151 Illiniwek Dr
- 9723 Weatherby St
- 9719 Iroquois Dr
- 415 Falling Leaf Way
- 1204 Gulfstream Way
- 27 Coachlight Dr
- 330 Grant Dr
- 717 Knipp Dr
- 1017 W Green St
- 924 Dere Bere Dr
- 926 W Green St
- 91 W Harnett St
- 652 Moorland Cir
- 1453 Lexi Ln
- 1220 Winding Oaks Ln
- 847 Topaz Ct
- 1138 Whimbrel Run
- 1142 Whimbrel Run
- 9633 Teal Ct
- 1146 Whimbrel Run
- 9632 Teal Ct
- 1139 Widgeon Dr
- 1143 Widgeon Dr
- 1134 Whimbrel Run
- 1130 Whimbrel Run
- 9629 Teal Ct
- 1135 Widgeon Dr
- 1126 Whimbrel Run
- 9640 Pheasant Bend
- 9628 Teal Ct
- 9624 Pheasant Bend
- 1131 Widgeon Dr
- 9627 Mallard Dr
- 9637 Pheasant Bend
- 9633 Pheasant Bend
- 1140 Widgeon Dr
Your Personal Tour Guide
Ask me questions while you tour the home.