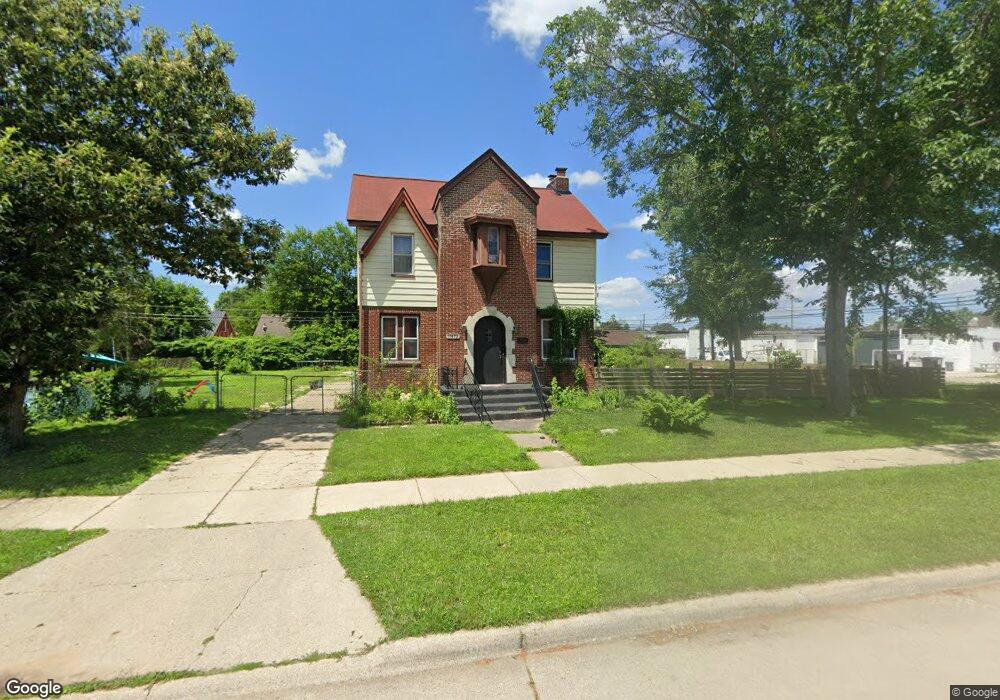
11473 Lucerne Redford, MI 48239
Estimated Value: $190,963 - $237,000
--
Bed
1
Bath
1,390
Sq Ft
$153/Sq Ft
Est. Value
About This Home
This home is located at 11473 Lucerne, Redford, MI 48239 and is currently estimated at $213,241, approximately $153 per square foot. 11473 Lucerne is a home located in Wayne County with nearby schools including John D. Pierce Middle School, Lee M. Thurston High School, and Westfield Charter Academy.
Ownership History
Date
Name
Owned For
Owner Type
Purchase Details
Closed on
Jul 30, 2025
Sold by
Izairi Misim
Bought by
Mustafai Maliq
Current Estimated Value
Home Financials for this Owner
Home Financials are based on the most recent Mortgage that was taken out on this home.
Original Mortgage
$168,000
Outstanding Balance
$167,713
Interest Rate
6.81%
Mortgage Type
New Conventional
Estimated Equity
$45,528
Purchase Details
Closed on
Sep 15, 2021
Sold by
Barile Silvio Salvatore Angelo
Bought by
Izairi Misim
Create a Home Valuation Report for This Property
The Home Valuation Report is an in-depth analysis detailing your home's value as well as a comparison with similar homes in the area
Home Values in the Area
Average Home Value in this Area
Purchase History
| Date | Buyer | Sale Price | Title Company |
|---|---|---|---|
| Mustafai Maliq | $210,000 | None Listed On Document | |
| Izairi Misim | $175,000 | Fidelity National Ttl Group |
Source: Public Records
Mortgage History
| Date | Status | Borrower | Loan Amount |
|---|---|---|---|
| Open | Mustafai Maliq | $168,000 |
Source: Public Records
Tax History Compared to Growth
Tax History
| Year | Tax Paid | Tax Assessment Tax Assessment Total Assessment is a certain percentage of the fair market value that is determined by local assessors to be the total taxable value of land and additions on the property. | Land | Improvement |
|---|---|---|---|---|
| 2025 | $2,107 | $88,300 | $0 | $0 |
| 2024 | $2,107 | $79,500 | $0 | $0 |
| 2023 | $2,014 | $69,500 | $0 | $0 |
| 2022 | $5,135 | $61,100 | $0 | $0 |
| 2021 | $1,976 | $58,800 | $0 | $0 |
| 2020 | $1,400 | $52,800 | $0 | $0 |
| 2019 | $2,044 | $42,400 | $0 | $0 |
| 2018 | $425 | $33,900 | $0 | $0 |
| 2017 | $1,471 | $32,600 | $0 | $0 |
| 2016 | $1,147 | $30,800 | $0 | $0 |
| 2015 | $1,786 | $28,500 | $0 | $0 |
| 2013 | $2,680 | $27,900 | $0 | $0 |
| 2012 | $2,370 | $38,600 | $6,600 | $32,000 |
Source: Public Records
Map
Nearby Homes