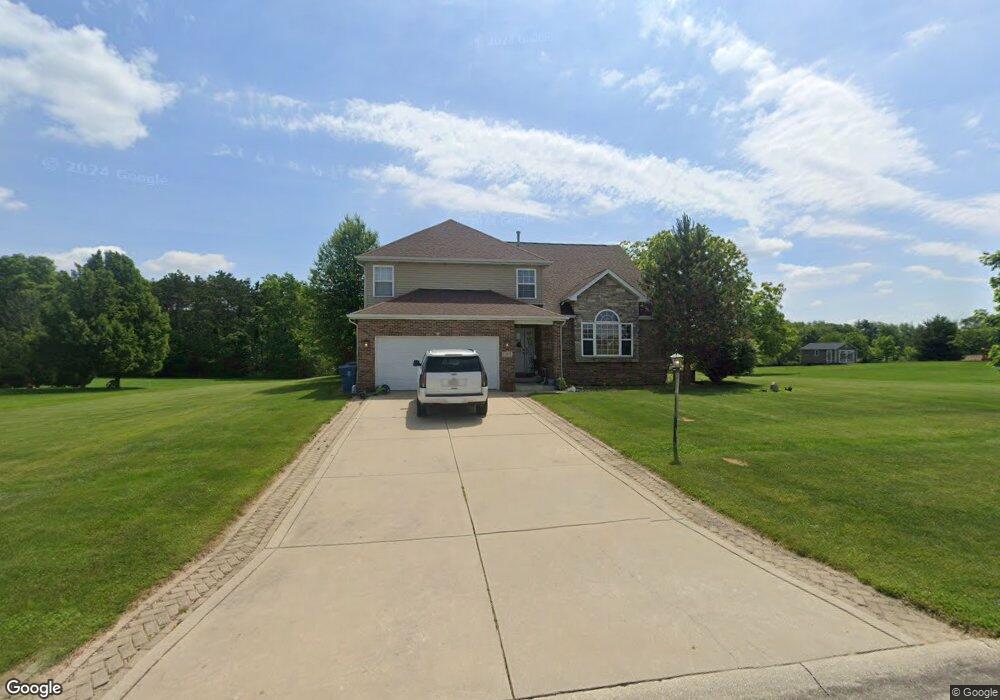
11475 Knox St Crown Point, IN 46307
Estimated Value: $469,284 - $506,000
4
Beds
3
Baths
3,536
Sq Ft
$137/Sq Ft
Est. Value
About This Home
This home is located at 11475 Knox St, Crown Point, IN 46307 and is currently estimated at $485,571, approximately $137 per square foot. 11475 Knox St is a home located in Lake County with nearby schools including Winfield Elementary School, Jerry Ross Elementary School, and Colonel John Wheeler Middle School.
Ownership History
Date
Name
Owned For
Owner Type
Purchase Details
Closed on
Nov 30, 2020
Sold by
Sutto Sean and Sutto Michele J
Bought by
Sutton Sean R and Sutton Michele J
Current Estimated Value
Purchase Details
Closed on
Sep 29, 2005
Sold by
Boardwalk Builders & Developers Llc
Bought by
Racovaz Edward H and Racovaz Margaret M
Home Financials for this Owner
Home Financials are based on the most recent Mortgage that was taken out on this home.
Original Mortgage
$32,100
Outstanding Balance
$17,365
Interest Rate
5.93%
Mortgage Type
Credit Line Revolving
Estimated Equity
$468,206
Purchase Details
Closed on
Aug 18, 2005
Sold by
Boardwalk Builders & Developers Llc
Bought by
Sutton Sean and Sutton Michele J
Home Financials for this Owner
Home Financials are based on the most recent Mortgage that was taken out on this home.
Original Mortgage
$32,100
Outstanding Balance
$17,365
Interest Rate
5.93%
Mortgage Type
Credit Line Revolving
Estimated Equity
$468,206
Create a Home Valuation Report for This Property
The Home Valuation Report is an in-depth analysis detailing your home's value as well as a comparison with similar homes in the area
Home Values in the Area
Average Home Value in this Area
Purchase History
| Date | Buyer | Sale Price | Title Company |
|---|---|---|---|
| Sutton Sean R | -- | None Available | |
| Racovaz Edward H | -- | Chicago Title Insurance Comp | |
| Sutton Sean | -- | Chicago Title Insurance Comp |
Source: Public Records
Mortgage History
| Date | Status | Borrower | Loan Amount |
|---|---|---|---|
| Open | Racovaz Edward H | $32,100 | |
| Previous Owner | Sutton Sean | $189,856 |
Source: Public Records
Tax History Compared to Growth
Tax History
| Year | Tax Paid | Tax Assessment Tax Assessment Total Assessment is a certain percentage of the fair market value that is determined by local assessors to be the total taxable value of land and additions on the property. | Land | Improvement |
|---|---|---|---|---|
| 2024 | $10,470 | $417,300 | $70,100 | $347,200 |
| 2023 | $8,556 | $387,800 | $70,100 | $317,700 |
| 2022 | $8,274 | $374,400 | $70,100 | $304,300 |
| 2021 | $7,470 | $345,800 | $66,100 | $279,700 |
| 2020 | $6,418 | $301,400 | $55,100 | $246,300 |
| 2019 | $6,465 | $311,600 | $55,100 | $256,500 |
| 2018 | $6,654 | $301,600 | $55,100 | $246,500 |
| 2017 | $3,314 | $279,500 | $45,800 | $233,700 |
| 2016 | $3,442 | $281,900 | $45,800 | $236,100 |
| 2014 | $3,326 | $285,200 | $45,800 | $239,400 |
| 2013 | $3,451 | $288,900 | $45,800 | $243,100 |
Source: Public Records
Map
Nearby Homes
- 10392 Knox St
- 10352 Knox St
- 11545 Knox St
- 11473 Clyde Dr
- 11469 Clyde Dr
- 11441 Clyde Dr
- 11602 Clyde Dr
- 11637 Clyde Dr
- 11643 Clyde Dr
- 11090 Green Place
- 10929 Green Place
- 5922 E 112th Ave
- 10937 Green Place
- 11170 Green Place
- 11186 Green Place
- 10951 Green Place
- 10949 Green Place
- 7264 E 115th Ave
- 7502 E 116th Ave
- 7482 E 116th Ave
- 11505 Knox St
- 11425 Knox St
- 11460 Knox St
- 11501 Jay St
- 11510 Knox St
- 6690 E 114th Place
- 6641 E 114th Place
- 11565 Knox St
- 11578 Knox St
- 6650 E 114th Place
- 11541 Jay St
- 11441 Jay St
- 11571 Jay St
- 6610 E 114th Place
- 6585 E 114th Place
- 11450 Jay St
- 11598 Knox St
- 11430 Jay St
- 11420 Jay St
- 6588 E 114th Place