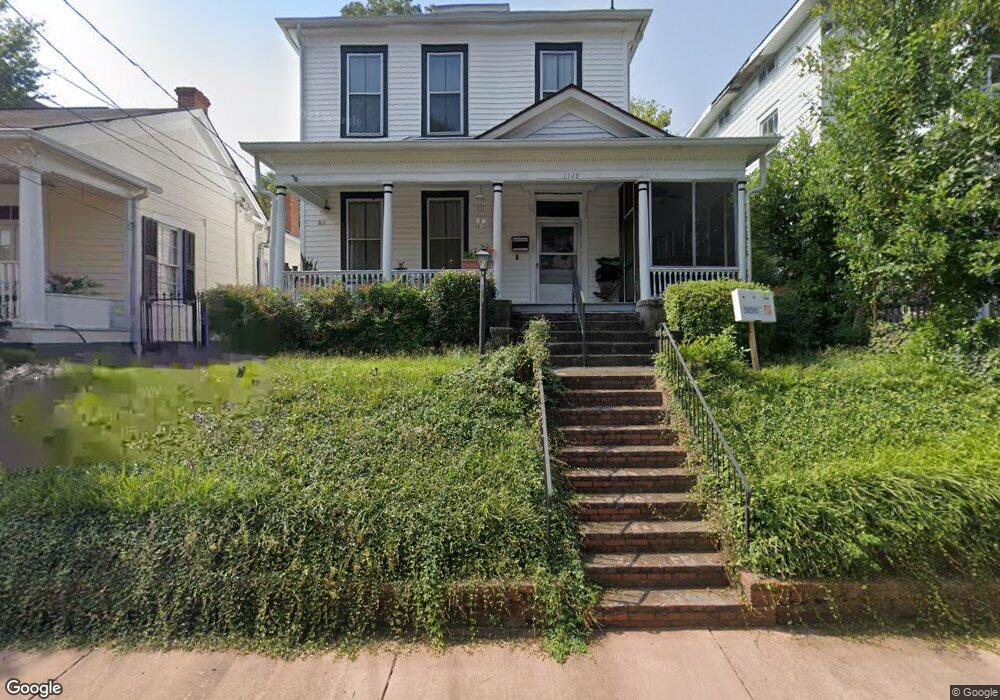
1148 Bond St Macon, GA 31201
InTown NeighborhoodEstimated Value: $268,502 - $294,000
4
Beds
3
Baths
2,167
Sq Ft
$129/Sq Ft
Est. Value
About This Home
This home is located at 1148 Bond St, Macon, GA 31201 and is currently estimated at $279,626, approximately $129 per square foot. 1148 Bond St is a home with nearby schools including Williams Elementary School, Miller Fine Arts Magnet Middle School, and Central High School.
Ownership History
Date
Name
Owned For
Owner Type
Purchase Details
Closed on
Aug 14, 2025
Sold by
Dees Nathan Jeremiah
Bought by
Nathan Dees Trust
Current Estimated Value
Purchase Details
Closed on
Jun 27, 2011
Sold by
Coleman Properties Inc
Bought by
Dees Nathan Jeremiah
Purchase Details
Closed on
Jun 15, 2011
Sold by
Fross Ronald Stephen
Bought by
Coleman Properties Inc
Purchase Details
Closed on
Jan 12, 2011
Sold by
Fross Ronald Stephen and Fross Mary Louise Johnston
Bought by
Fross Ronald Stephen
Purchase Details
Closed on
Sep 21, 2010
Sold by
Fross Ronald Stephen and Fross Rudolph Jacob
Bought by
Fross Mary Louise Johnston
Create a Home Valuation Report for This Property
The Home Valuation Report is an in-depth analysis detailing your home's value as well as a comparison with similar homes in the area
Home Values in the Area
Average Home Value in this Area
Purchase History
| Date | Buyer | Sale Price | Title Company |
|---|---|---|---|
| Nathan Dees Trust | -- | None Listed On Document | |
| Nathan Dees Trust | -- | None Listed On Document | |
| Dees Nathan Jeremiah | $42,500 | None Available | |
| Coleman Properties Inc | $19,600 | None Available | |
| Fross Ronald Stephen | -- | None Available | |
| Fross Mary Louise Johnston | -- | None Available |
Source: Public Records
Tax History
| Year | Tax Paid | Tax Assessment Tax Assessment Total Assessment is a certain percentage of the fair market value that is determined by local assessors to be the total taxable value of land and additions on the property. | Land | Improvement |
|---|---|---|---|---|
| 2025 | $2,192 | $96,199 | $12,960 | $83,239 |
| 2024 | $2,175 | $92,657 | $12,960 | $79,697 |
| 2023 | $1,459 | $82,431 | $8,400 | $74,031 |
| 2022 | $2,362 | $75,216 | $9,737 | $65,479 |
| 2021 | $1,618 | $68,113 | $9,737 | $58,376 |
| 2020 | $935 | $60,548 | $9,274 | $51,274 |
| 2019 | $942 | $60,548 | $9,274 | $51,274 |
| 2018 | $2,043 | $60,548 | $9,274 | $51,274 |
| 2017 | $1,164 | $60,548 | $9,274 | $51,274 |
| 2016 | $1,075 | $60,548 | $9,274 | $51,274 |
| 2015 | $1,522 | $60,548 | $9,274 | $51,274 |
| 2014 | $1,750 | $26,787 | $9,274 | $17,513 |
Source: Public Records
Map
Nearby Homes
- 312 College St Unit 3
- 1120 Georgia Ave
- 349 Madison St
- 132 Madison St
- 353 Madison St
- 417 Orange St
- 338 Monroe St
- 1740 5th Ave W
- 619 College St
- 1812 5th Ave W
- 676 College St
- 632 Monroe St
- 336 Empire Ave
- 1837 2nd Ave
- 253 Pursley St
- 237 Pursley St
- 1942 Walnut St
- 1825 Hardeman Ave
- 1963 3rd Ave
- 565 Poplar St
Your Personal Tour Guide
Ask me questions while you tour the home.