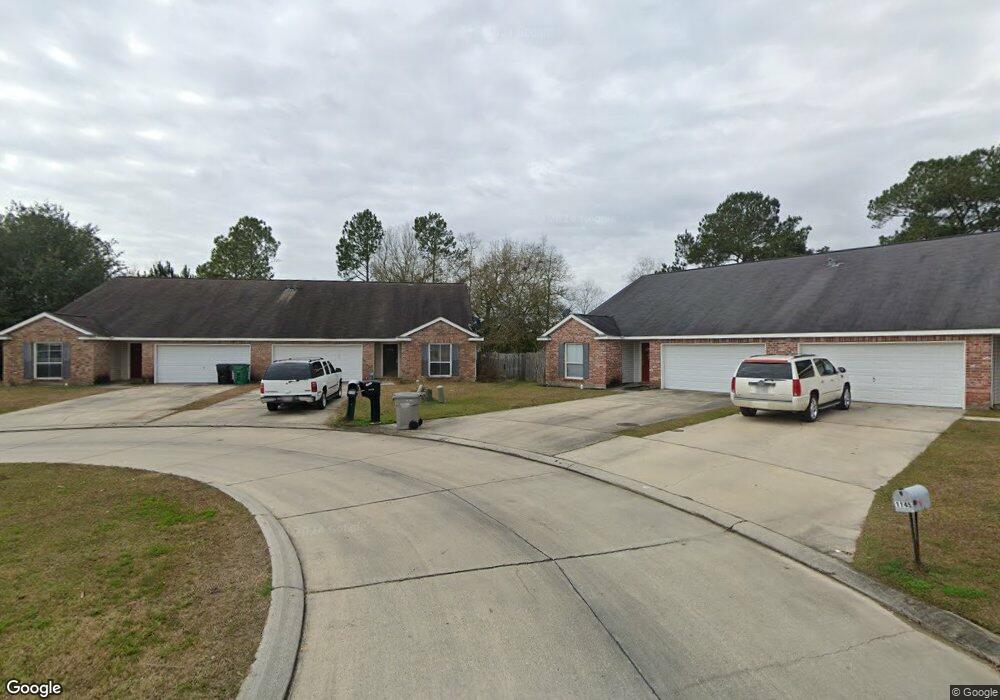
1148 Clairise (Lot 10a) Ct Slidell, LA 70461
Estimated Value: $187,000 - $203,000
3
Beds
2
Baths
1,777
Sq Ft
$109/Sq Ft
Est. Value
About This Home
This home is located at 1148 Clairise (Lot 10a) Ct, Slidell, LA 70461 and is currently estimated at $193,459, approximately $108 per square foot. 1148 Clairise (Lot 10a) Ct is a home located in St. Tammany Parish with nearby schools including W.L. Abney Elementary School, St. Tammany Junior High School, and Salmen High School.
Ownership History
Date
Name
Owned For
Owner Type
Purchase Details
Closed on
Nov 19, 2021
Sold by
Bston Lara A and Boston Frank E
Bought by
Larvinette Taynisha Aquanet
Current Estimated Value
Home Financials for this Owner
Home Financials are based on the most recent Mortgage that was taken out on this home.
Original Mortgage
$190,908
Outstanding Balance
$175,176
Interest Rate
3.09%
Mortgage Type
New Conventional
Estimated Equity
$18,283
Purchase Details
Closed on
Feb 25, 2020
Sold by
Fannie Mae
Bought by
Boston Frank E and Boston Lara A
Home Financials for this Owner
Home Financials are based on the most recent Mortgage that was taken out on this home.
Original Mortgage
$142,708
Interest Rate
3.5%
Mortgage Type
VA
Purchase Details
Closed on
Apr 10, 2019
Sold by
Bayview Loan Servicing Llc
Bought by
Federal National Mortgage Association
Create a Home Valuation Report for This Property
The Home Valuation Report is an in-depth analysis detailing your home's value as well as a comparison with similar homes in the area
Home Values in the Area
Average Home Value in this Area
Purchase History
| Date | Buyer | Sale Price | Title Company |
|---|---|---|---|
| Larvinette Taynisha Aquanet | $189,000 | Property Title Inc | |
| Boston Frank E | $139,500 | None Available | |
| Federal National Mortgage Association | $91,000 | None Available |
Source: Public Records
Mortgage History
| Date | Status | Borrower | Loan Amount |
|---|---|---|---|
| Open | Larvinette Taynisha Aquanet | $190,908 | |
| Previous Owner | Boston Frank E | $142,708 |
Source: Public Records
Tax History Compared to Growth
Tax History
| Year | Tax Paid | Tax Assessment Tax Assessment Total Assessment is a certain percentage of the fair market value that is determined by local assessors to be the total taxable value of land and additions on the property. | Land | Improvement |
|---|---|---|---|---|
| 2024 | $1,679 | $18,544 | $1,250 | $17,294 |
| 2023 | $1,736 | $14,875 | $1,250 | $13,625 |
| 2022 | $121,978 | $14,875 | $1,250 | $13,625 |
| 2021 | $2,157 | $14,007 | $1,250 | $12,757 |
| 2020 | $2,147 | $14,007 | $1,250 | $12,757 |
| 2019 | $2,053 | $12,852 | $1,300 | $11,552 |
| 2018 | $2,060 | $12,852 | $1,300 | $11,552 |
| 2017 | $2,072 | $12,852 | $1,300 | $11,552 |
| 2016 | $2,118 | $12,852 | $1,300 | $11,552 |
| 2015 | $930 | $12,358 | $1,250 | $11,108 |
| 2014 | $915 | $12,358 | $1,250 | $11,108 |
| 2013 | -- | $12,358 | $1,250 | $11,108 |
Source: Public Records
Map
Nearby Homes
- 1140 Clarise Ct
- 1136 Clairise (Lot 11b) Ct
- 1136 Clairise Ct
- 1132 Clairise Ct
- 1128 Clairise (Lot 12b) Ct
- 1140 Clairise Ct
- 1140 Clairise Ct Unit 1
- 1148 Clairise Ct
- 1132 Clairise (Lot 12a) Ct
- 1124 Clairise Ct
- 1144 Clairise Ct
- 1129 Clairise (Lot 7a) Ct
- 1120 Clairise (Lot 13b) Ct
- 1149 Clairise Ct
- 1133 Clairise (Lot 7b) Ct
- 1133 Clairise Ct
- 1137 Clairise Ct
- 1120 Clairise Ct
- 1129 Clairise Ct
- 1125 Clairise Ct