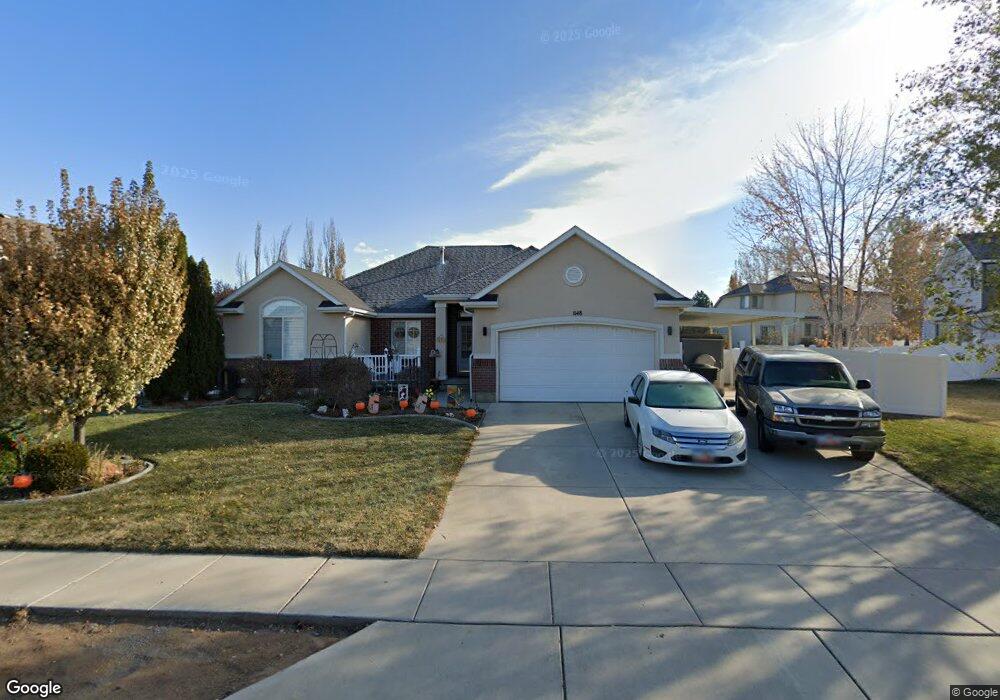
1148 N 1230 W Clearfield, UT 84015
Estimated Value: $586,000 - $616,000
3
Beds
4
Baths
3,492
Sq Ft
$171/Sq Ft
Est. Value
About This Home
This home is located at 1148 N 1230 W, Clearfield, UT 84015 and is currently estimated at $596,706, approximately $170 per square foot. 1148 N 1230 W is a home located in Davis County with nearby schools including Clinton Elementary School, Sunset Junior High School, and Clearfield High School.
Ownership History
Date
Name
Owned For
Owner Type
Purchase Details
Closed on
Oct 7, 2021
Sold by
Stuart Paul C and Stuart Danette S
Bought by
Stuart Paul C and Stuart Danette S
Current Estimated Value
Purchase Details
Closed on
Mar 9, 2016
Sold by
Cahoon Wayne S and Cahoon Rose Marie
Bought by
Stuart Paul C and Stuart Danette S
Purchase Details
Closed on
Sep 8, 2004
Sold by
Shaw Kimberly
Bought by
Cahoon Wayne S and Cahoon Rose Marie
Home Financials for this Owner
Home Financials are based on the most recent Mortgage that was taken out on this home.
Original Mortgage
$41,000
Interest Rate
6.06%
Mortgage Type
Purchase Money Mortgage
Purchase Details
Closed on
Aug 22, 2001
Sold by
Ivory Homes Ltd
Bought by
Gmw Development Inc
Home Financials for this Owner
Home Financials are based on the most recent Mortgage that was taken out on this home.
Original Mortgage
$185,804
Interest Rate
7.21%
Create a Home Valuation Report for This Property
The Home Valuation Report is an in-depth analysis detailing your home's value as well as a comparison with similar homes in the area
Home Values in the Area
Average Home Value in this Area
Purchase History
| Date | Buyer | Sale Price | Title Company |
|---|---|---|---|
| Stuart Paul C | -- | None Available | |
| Stuart Paul C | -- | Us Title | |
| Cahoon Wayne S | -- | Equity Title Agency | |
| Gmw Development Inc | -- | Bonneville Title Company Inc | |
| Shaw Kimberly | -- | Bonneville Title Company Inc |
Source: Public Records
Mortgage History
| Date | Status | Borrower | Loan Amount |
|---|---|---|---|
| Previous Owner | Cahoon Wayne S | $41,000 | |
| Previous Owner | Shaw Kimberly | $185,804 |
Source: Public Records
Tax History Compared to Growth
Tax History
| Year | Tax Paid | Tax Assessment Tax Assessment Total Assessment is a certain percentage of the fair market value that is determined by local assessors to be the total taxable value of land and additions on the property. | Land | Improvement |
|---|---|---|---|---|
| 2025 | $3,083 | $296,450 | $95,402 | $201,048 |
| 2024 | $3,113 | $300,850 | $104,335 | $196,515 |
| 2023 | $2,952 | $528,000 | $119,641 | $408,359 |
| 2022 | $3,147 | $311,300 | $72,048 | $239,252 |
| 2021 | $2,848 | $418,000 | $92,123 | $325,877 |
| 2020 | $2,485 | $361,000 | $79,316 | $281,684 |
| 2019 | $2,410 | $342,000 | $90,770 | $251,230 |
| 2018 | $2,260 | $315,000 | $76,421 | $238,579 |
| 2016 | $2,032 | $146,246 | $28,166 | $118,080 |
| 2015 | $1,844 | $126,226 | $28,166 | $98,060 |
| 2014 | $1,760 | $122,385 | $28,166 | $94,219 |
| 2013 | -- | $117,808 | $27,143 | $90,665 |
Source: Public Records
Map
Nearby Homes
- 1242 W 1075 N
- 984 N 1100 W
- 1122 N 1500 W
- 1121 N 900 W
- 1463 N 1250 W
- 1479 N 1320 W
- 1038 W 800 N
- 844 N 1000 W
- 922 W 1420 N
- 1197 W 1580 N
- 1174 W 1580 N
- 1143 W 1640 N
- 1214 N 700 W
- 1716 N 1300 W
- 1657 N 1500 W
- 690 Barlow St
- 563 N 1350 W Unit 139
- 1350 W 300 N Unit 49
- 1350 W 300 N Unit 38
- 1350 W 300 N Unit 29