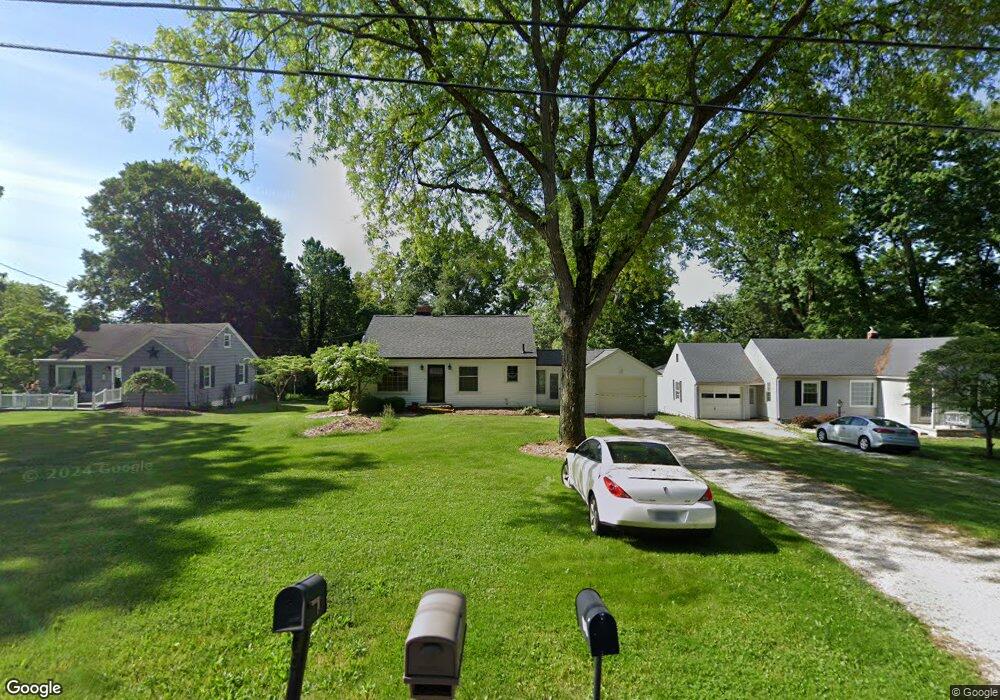
1148 W Overton Dr New Franklin, OH 44319
Estimated Value: $155,000 - $207,000
2
Beds
1
Bath
896
Sq Ft
$199/Sq Ft
Est. Value
About This Home
This home is located at 1148 W Overton Dr, New Franklin, OH 44319 and is currently estimated at $178,335, approximately $199 per square foot. 1148 W Overton Dr is a home located in Summit County with nearby schools including Coventry Middle School, Coventry High School, and St. Francis de Sales School.
Ownership History
Date
Name
Owned For
Owner Type
Purchase Details
Closed on
Oct 19, 2006
Sold by
Kontra Thomas
Bought by
Reed Jamie L
Current Estimated Value
Home Financials for this Owner
Home Financials are based on the most recent Mortgage that was taken out on this home.
Original Mortgage
$60,004
Outstanding Balance
$35,885
Interest Rate
6.5%
Mortgage Type
Purchase Money Mortgage
Estimated Equity
$142,450
Purchase Details
Closed on
Apr 20, 2006
Sold by
Bedlion Barry and Bedlion Heatler
Bought by
Kontra Thomas and The 1148 West Overton Drive Residential
Purchase Details
Closed on
Dec 27, 2002
Sold by
Miller Ruth E
Bought by
Bedlion Barry A and Bedlion Heather R
Home Financials for this Owner
Home Financials are based on the most recent Mortgage that was taken out on this home.
Original Mortgage
$82,450
Interest Rate
6.01%
Create a Home Valuation Report for This Property
The Home Valuation Report is an in-depth analysis detailing your home's value as well as a comparison with similar homes in the area
Home Values in the Area
Average Home Value in this Area
Purchase History
| Date | Buyer | Sale Price | Title Company |
|---|---|---|---|
| Reed Jamie L | $75,100 | Cresent Title Agency Llc | |
| Kontra Thomas | -- | None Available | |
| Bedlion Barry A | $85,000 | Real Living Title Agency Ltd |
Source: Public Records
Mortgage History
| Date | Status | Borrower | Loan Amount |
|---|---|---|---|
| Open | Reed Jamie L | $60,004 | |
| Previous Owner | Bedlion Barry A | $82,450 |
Source: Public Records
Tax History Compared to Growth
Tax History
| Year | Tax Paid | Tax Assessment Tax Assessment Total Assessment is a certain percentage of the fair market value that is determined by local assessors to be the total taxable value of land and additions on the property. | Land | Improvement |
|---|---|---|---|---|
| 2025 | $2,603 | $51,702 | $12,047 | $39,655 |
| 2024 | $2,603 | $51,702 | $12,047 | $39,655 |
| 2023 | $2,603 | $51,702 | $12,047 | $39,655 |
| 2022 | $2,235 | $37,199 | $8,670 | $28,529 |
| 2021 | $2,200 | $37,199 | $8,670 | $28,529 |
| 2020 | $2,140 | $37,200 | $8,670 | $28,530 |
| 2019 | $1,677 | $26,710 | $6,500 | $20,210 |
| 2018 | $1,657 | $26,710 | $6,500 | $20,210 |
| 2017 | $1,517 | $26,710 | $6,500 | $20,210 |
| 2016 | $1,500 | $22,530 | $6,500 | $16,030 |
| 2015 | $1,517 | $22,530 | $6,500 | $16,030 |
| 2014 | $1,522 | $22,530 | $6,500 | $16,030 |
| 2013 | $1,509 | $22,650 | $6,500 | $16,150 |
Source: Public Records
Map
Nearby Homes
- 4698 Manchester Rd
- 4216 State Rd
- 855 Fowler Ave
- 3826 Powell Ave
- 4851 Manchester Rd
- 0 W Turkeyfoot Lake Rd Unit 5157637
- 3809 Powell Ave
- 834 State Mill Rd
- 4567 Rex Lake Dr
- 1850 Turkeyfoot Lake Rd
- 3719 Bower Ave
- 3803 Bay Path Dr
- 375 Big Bend Cir
- 552 Saunders Ave
- 986 S Azalea Blvd
- 4135 State Park Dr
- 951 S Azalea Blvd
- 1283 S Azalea Blvd
- 796 Portage Lakes Dr
- 441 Dorwil Dr
- 1154 W Overton Dr
- 1140 W Overton Dr
- 1160 W Overton Dr
- 1160 W Overton Dr
- 1160 W Overton Dr
- 1160 W Overton Dr
- 1143 W Overton Dr
- 1147 W Overton Dr
- 1134 W Overton Dr
- 1161 W Overton Dr
- 1137 W Overton Dr
- 1128 W Overton Dr
- 1123 W Overton Dr
- 4406 Wilcor Dr
- 17 E Buddy St
- 1120 W Overton Dr
- 4385 Wilcor Dr
- 4386 Wilcor Dr
- 4382 Wilcor Dr
- 1112 W Overton Dr