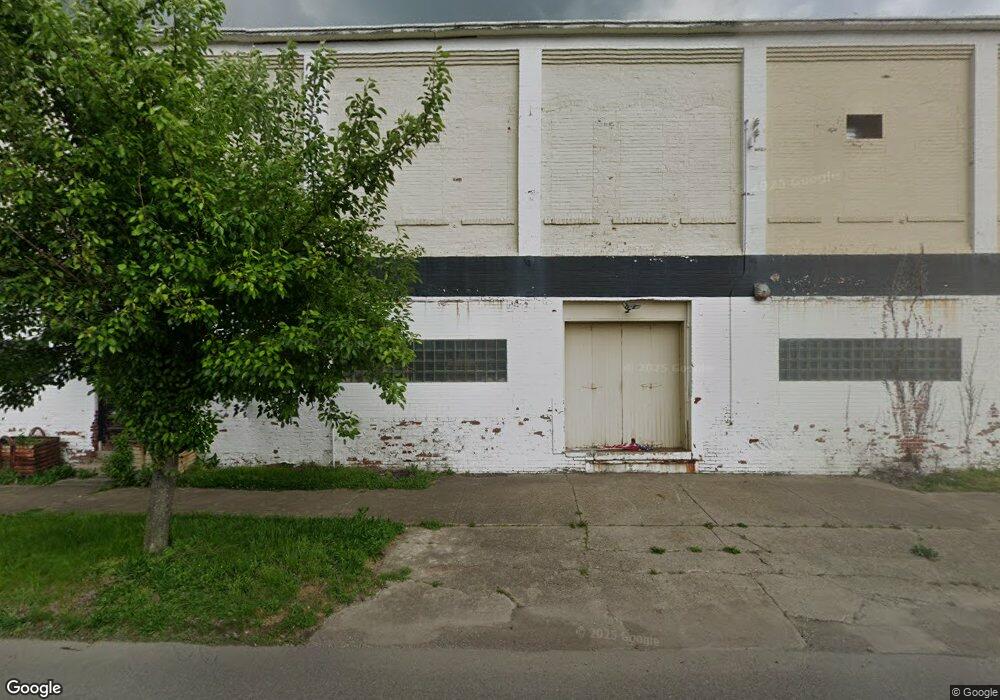
1148 Walnut St Coshocton, OH 43812
Estimated Value: $51,196
Studio
--
Bath
53,523
Sq Ft
$1/Sq Ft
Est. Value
About This Home
This home is located at 1148 Walnut St, Coshocton, OH 43812 and is currently estimated at $51,196, approximately $0 per square foot. 1148 Walnut St is a home located in Coshocton County with nearby schools including Coshocton High School, Coshocton Opportunity School, and Sacred Heart School.
Ownership History
Date
Name
Owned For
Owner Type
Purchase Details
Closed on
Jul 12, 2023
Sold by
1148 Walnut Street Project Llc
Bought by
Marlow Investment Group Llc
Current Estimated Value
Purchase Details
Closed on
Jun 2, 2022
Sold by
Home Loan Savings Bank
Bought by
1148 Walnut Street Project Llc
Purchase Details
Closed on
Apr 29, 2020
Sold by
Rogers Timothy L
Bought by
The Home Loan Savings Bank
Create a Home Valuation Report for This Property
The Home Valuation Report is an in-depth analysis detailing your home's value as well as a comparison with similar homes in the area
Home Values in the Area
Average Home Value in this Area
Purchase History
| Date | Buyer | Sale Price | Title Company |
|---|---|---|---|
| Marlow Investment Group Llc | $43,750 | None Listed On Document | |
| Marlow Investment Group Llc | $43,750 | None Listed On Document | |
| 1148 Walnut Street Project Llc | $110,750 | None Listed On Document | |
| 1148 Walnut Street Project Llc | $110,750 | None Listed On Document | |
| The Home Loan Savings Bank | $20,000 | None Available |
Source: Public Records
Tax History
| Year | Tax Paid | Tax Assessment Tax Assessment Total Assessment is a certain percentage of the fair market value that is determined by local assessors to be the total taxable value of land and additions on the property. | Land | Improvement |
|---|---|---|---|---|
| 2024 | $1,007 | $16,000 | $10,060 | $5,940 |
| 2023 | $1,007 | $24,150 | $24,150 | $0 |
| 2022 | $10,648 | $174,199 | $48,465 | $125,734 |
| 2021 | $9,439 | $154,322 | $28,588 | $125,734 |
| 2020 | $10,303 | $154,305 | $28,588 | $125,717 |
| 2019 | $10,387 | $154,305 | $28,588 | $125,717 |
| 2018 | $9,958 | $154,305 | $28,588 | $125,717 |
| 2017 | $9,877 | $154,305 | $28,588 | $125,717 |
| 2016 | $9,609 | $154,305 | $28,588 | $125,717 |
| 2015 | $4,783 | $154,305 | $28,588 | $125,717 |
| 2014 | $8,641 | $152,341 | $28,588 | $123,753 |
Source: Public Records
Map
Nearby Homes
Your Personal Tour Guide
Ask me questions while you tour the home.