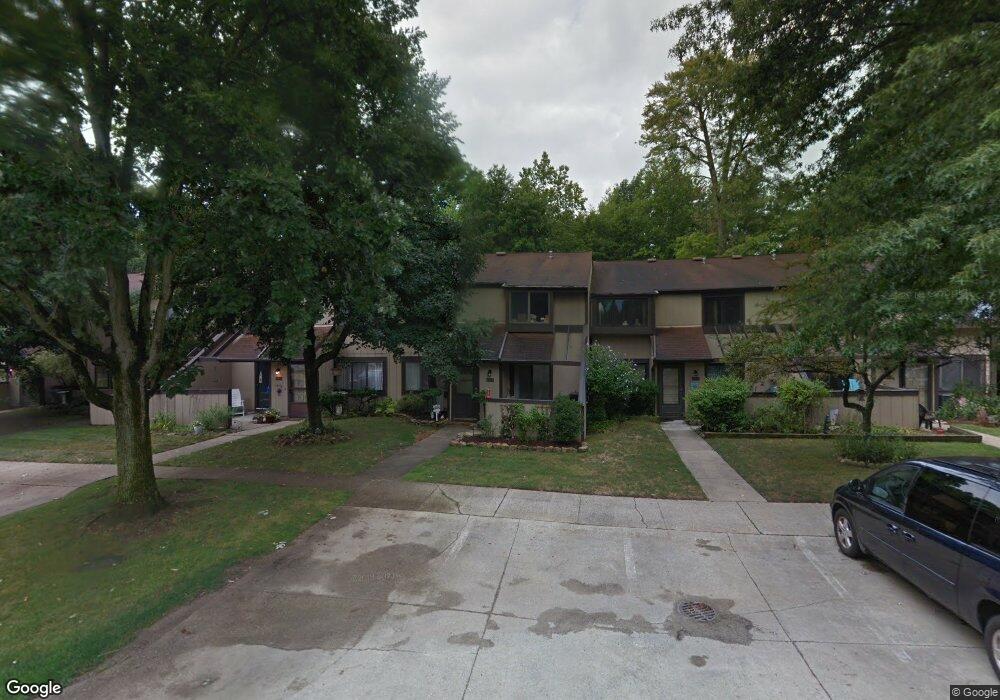
11481 Harbour Light Dr Unit 1481 North Royalton, OH 44133
Estimated Value: $167,000 - $170,000
2
Beds
2
Baths
1,224
Sq Ft
$137/Sq Ft
Est. Value
About This Home
This home is located at 11481 Harbour Light Dr Unit 1481, North Royalton, OH 44133 and is currently estimated at $167,855, approximately $137 per square foot. 11481 Harbour Light Dr Unit 1481 is a home located in Cuyahoga County with nearby schools including North Royalton Middle School, North Royalton High School, and Royal Redeemer Lutheran School.
Ownership History
Date
Name
Owned For
Owner Type
Purchase Details
Closed on
Mar 8, 2010
Sold by
Fifth Third Bank
Bought by
Beal Brent M
Current Estimated Value
Home Financials for this Owner
Home Financials are based on the most recent Mortgage that was taken out on this home.
Original Mortgage
$39,100
Interest Rate
4.96%
Mortgage Type
Unknown
Purchase Details
Closed on
Feb 17, 2010
Sold by
Cavallo Carolyn B
Bought by
Fifth Third Bank
Home Financials for this Owner
Home Financials are based on the most recent Mortgage that was taken out on this home.
Original Mortgage
$39,100
Interest Rate
4.96%
Mortgage Type
Unknown
Purchase Details
Closed on
Aug 2, 2007
Sold by
Cavallo Jeffry A
Bought by
Carolyn Cavallo Carolyn B and Carolyn Rigsny
Purchase Details
Closed on
Aug 1, 1985
Sold by
Wilke Janet L
Bought by
Holan David A and Holan Carolyn B
Purchase Details
Closed on
Jan 1, 1978
Bought by
Wilke Janet L
Create a Home Valuation Report for This Property
The Home Valuation Report is an in-depth analysis detailing your home's value as well as a comparison with similar homes in the area
Home Values in the Area
Average Home Value in this Area
Purchase History
| Date | Buyer | Sale Price | Title Company |
|---|---|---|---|
| Beal Brent M | $55,900 | Fidelity Land Title Agency | |
| Fifth Third Bank | $40,000 | None Available | |
| Carolyn Cavallo Carolyn B | -- | Attorney | |
| Holan David A | $44,500 | -- | |
| Wilke Janet L | -- | -- |
Source: Public Records
Mortgage History
| Date | Status | Borrower | Loan Amount |
|---|---|---|---|
| Previous Owner | Beal Brent M | $39,100 |
Source: Public Records
Tax History Compared to Growth
Tax History
| Year | Tax Paid | Tax Assessment Tax Assessment Total Assessment is a certain percentage of the fair market value that is determined by local assessors to be the total taxable value of land and additions on the property. | Land | Improvement |
|---|---|---|---|---|
| 2024 | $2,848 | $49,035 | $4,900 | $44,135 |
| 2023 | $2,141 | $33,810 | $3,360 | $30,450 |
| 2022 | $2,127 | $33,810 | $3,360 | $30,450 |
| 2021 | $2,149 | $33,810 | $3,360 | $30,450 |
| 2020 | $1,714 | $25,620 | $2,560 | $23,070 |
| 2019 | $1,664 | $73,200 | $7,300 | $65,900 |
| 2018 | $1,345 | $25,620 | $2,560 | $23,070 |
| 2017 | $1,806 | $15,650 | $2,560 | $13,090 |
| 2016 | $1,008 | $15,650 | $2,560 | $13,090 |
| 2015 | $1,270 | $15,650 | $2,560 | $13,090 |
| 2014 | $1,270 | $19,570 | $3,190 | $16,380 |
Source: Public Records
Map
Nearby Homes
- 11445 Harbour Light Dr
- 11650 Harbour Light Dr Unit 1650
- 9821 Sunrise Blvd Unit o1
- 10560 Independence Dr Unit 25A
- 9800 Cove Dr Unit H2
- 11806 Harbour Light Dr Unit 1806
- 9761 Sunrise Blvd
- 10364 Independence Dr Unit 19c
- 9710 Cove Dr Unit 23G
- 10342 Independence Dr Unit 21B
- 9660 Cove Dr Unit F13
- 9630 Cove Dr Unit A-14
- 9611 Sunrise Blvd Unit K2
- 9530 Cove Dr Unit C-25
- 9510 Cove Dr Unit C12
- 11550 York Rd
- 10641 Albion Rd
- 10700 Abbey Rd
- 9035 Wallings Rd
- 9938 Abbey Rd
- 11495 Harbour Light Dr Unit 1495
- 11477 Harbour Light Dr Unit 1477
- 11489 Harbour Light Dr Unit 1489
- 11499 Harbour Light Dr Unit 1499
- 11495 Harbour Light Dr
- 11497 Harbour Light Dr
- 11493 Harbour Light Dr Unit 1493
- 11491 Harbour Light Dr
- 11473 Harbour Light Dr
- 11475 Harbour Light Dr
- 11479 Harbour Light Dr
- 11483 Harbour Light Dr
- 11485 Harbour Light Dr
- 11495 Harbour Light Dr Unit 11495
- 11487 Harbour Light Dr
- 11447 Harbour Light Dr Unit 1447
- 11463 Harbour Light Dr Unit 1463
- 11449 Harbour Light Dr Unit 1449
- 11465 Harbour Light Dr Unit 1465
- 11459 Harbour Light Dr Unit 1459